
Imagine this scenario, you are a database professional at your place of business and you look after a mountain of SQL Server databases and it is a battle just to keep the lights on. If this sounds like you then you need all the help you can get. You can find this help from https://www.BrentOzar.com/first-aid/ where Brent, his team and community members (found here https://github.com/BrentOzarULTD/SQL-Server-First-Responder-Kit/graphs/contributors) have developed something known as the First Responder Kit and let me tell you, it will make your life “easier”. (In the long term)
For this blog post I am going to get “close and personal” with this kit just to show you the true power of it. Nobody has asked me to write this, I wanted to because I use it and value it and some of the commands are my “go to” queries and I thought that it would be nice see an overview.
sp_Blitz
After running this command you will know whether or not you need to get your surgery gloves out and “fix up” a specific SQL Server. This command will find things which will probably make your eyes water. It is powerful because not only does it find certain concepts about your environment but it ranks them too. Look at my system.
The code breaks the output into different “Finding Groups”: Backups, corruption, reliability, performance, file configuration, informational, monitoring, non-active server configuration and security. There are probably more but that is what I was alerted on.
EXEC sp_Blitz
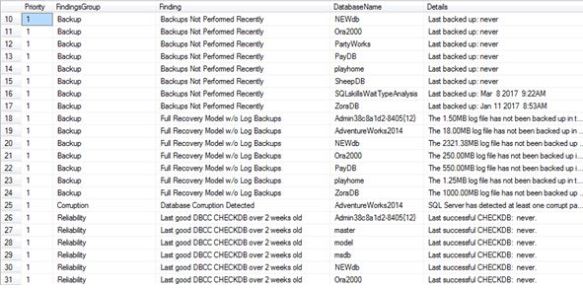
Look at my priority 1’s, I told you it would be eye watering. The command even tells you if you have database corruption, not only will it tell you about the actual details but there is a URL column for further help.
So if we dig into the corruption finding it states: Database Corruption Detected AdventureWorks2014 SQL Server has detected at least one corrupt page in the last 30 days. For more information, query the system table msdb.dbo.suspect_pages.
So I did.
SELECT * FROM msdb.dbo.suspect_pages
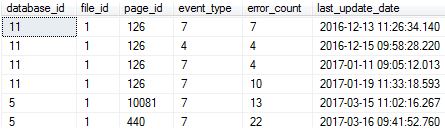
Yes – this is bad right?
It terms of reliability it will tell you such concepts as whether you recently had memory dumps. I told you it goes into depth.

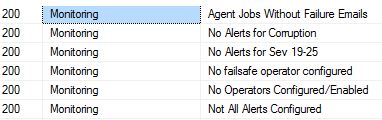
Under the monitoring group you will read about findings which I absolutely set on my servers and so should you.
If you want to query certain levels / groups I suggest moving the data into a table, all mentioned in official documentation.
EXEC sp_Blitz
  @OutputDatabaseName = 'DBAtools',
  @OutputSchemaName = 'dbo',
  @OutputTableName = 'Blitz'
You will then become slightly more flexible, maybe you want to look at a specific database only?
SELECT * FROM [dbo].[Blitz]
WHERE DatabaseName = 'ZoraDB'
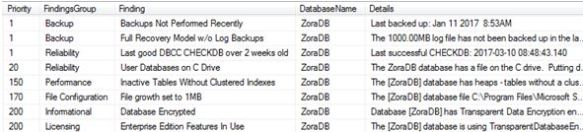
From no backups to heaps it tells you all.
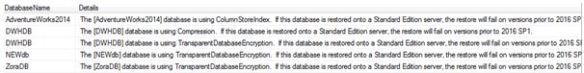
Ever wanted a single view of what Enterprise edition features you are using across the server? No problem.
SELECT * FROM [dbo].[Blitz]
WHERE Finding ='Enterprise Edition Features In Use'
The security information is paramount for me and I put it to the test, before running the stored procedure I granted a SQL login CONTROL SERVER permission, did it find it? Yes it did.
SELECT * from [dbo].[Blitz]
WHERE FindingsGroup = 'Security'

What is my favourite comment that I have found so far? An easy winner:
Non-Production License – We’re not the licensing police, but if this is supposed to be a production server, and you’re running Developer Edition (64-bit) the good folks at Microsoft might get upset with you. Better start counting those cores…. I better start checking that bank balance too.
This command will basically tell you how busy you will be in the coming weeks, it’s time to accept the challenge and run it. Sip that coffee first.
sp_BlitzFirst
Your mobile phone is ringing, it is your helpdesk alerting you of incoming incidents, the database is said to be the problem (yes we have all heard that before) who are going to call? I call upon sp_BlitzFirst.
EXEC sp_BlitzFirst
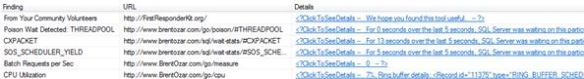
(Apparently I have a “poison” wait – THREADPOOL….)
To really get some detailed information I personally use “expert” mode while increasing the duration of the check, this is relevant whilst you are having the performance issue. As you can see below I activate expert mode for 60 seconds.
EXEC sp_BlitzFirst @ExpertMode = 1, @Seconds = 60
This is very detailed and holds pretty much all you need to know about your performance metrics bar latches and spinlocks.
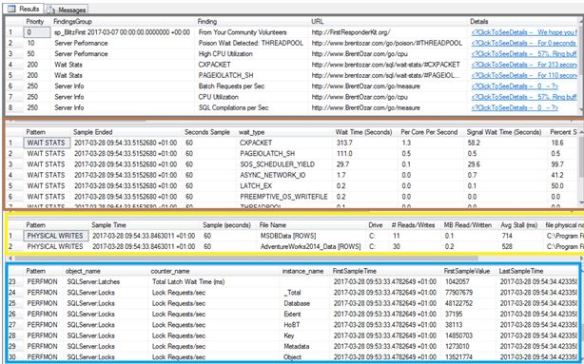
I have colour coded the areas of interest – the first window is similar to what you will get from running the default command. The second window shows you wait stats for the duration of the time sample, third window shows you I/O patterns and you can see I was having high average write Stall (m/s) on data files built on the C drive. Lastly Perfmon counters which is really good because it tells you about the DELTAS. It is not a basic output where it is giving you just a figure at a specific point in time; it actually captures the difference between a first sample and last sample time.
To find out what was causing this you actually need sp_BlitzWho. So if you have this installed you will then be given another output window with currently executing queries real time.

That dbo.CPUsmash stored procedure is giving me some grieve, you can actually extract the query plan too.
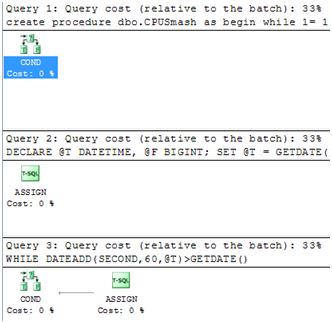
The DBCC CHECKDB command isn’t helping either, here is sp_BlitzWho telling me that it is going parallel.
EXEC sp_BlitzWho

Sp_BlitzCache
I am trying to change the way I am and I want to be proactive for once, one way is to start from the plan cache and see what is lurking there and maybe I can target the expensive queries as opposed to waiting for people to moan.
EXEC sp_BlitzCache @SortOrder = 'CPU'
I actually want to start the process by ordering by CPU first. Under the basic execution you will have 2 windows; the top window is where you will find the code that is using the most CPU (circled in blue).
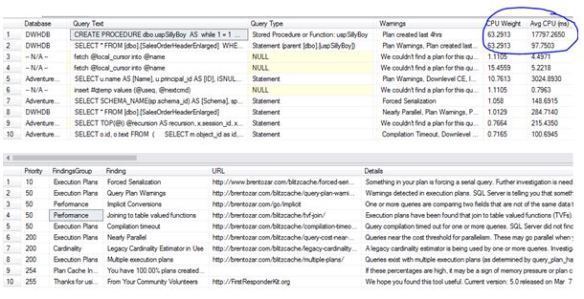
The bottom window looks to me like a general findings section where you will need to manually dig in deeper, but first let’s look at the top window.
There are 3 very important columns here – SQL handle, Query Plan and SET options used which are all important to understand. The proactive nature of this check is that I am going to change that plan shape for that high CPU consuming query (for the better).
Quite simply click the hyper link (not shown above, but there is a column for it) to get the plan details.
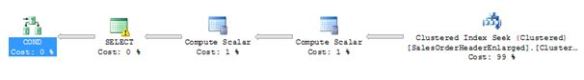
If this is not enough for you, once again, you can go “expert mode”. This gets very detailed, from the extra output you can start figuring out whether or not your plan is stable (query hash vs query plan hash analysis).
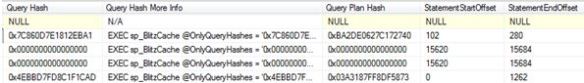
You can also directly use sp_BlitzCache against a query hash.
EXEC sp_BlitzCache @OnlyQueryHashes = '0x7C860D7E1812EBA1';
Now is probably a good time to re-write that query.
Sp_BlitzIndex
If you are into your indexes and like indexing tuning then this is a great tool to check your database out, you might be surprised about what it tells you.
The basic execution is usually done under the context of the database.
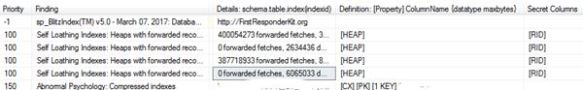
Well this is an eye opener, multiple heaps with some with ridiculous amount of forwarded records and more confusingly, I have abnormal psychology? Now you have my attention Brent!
Moving onto the next level, where mode 1 means a summary of database metrics.
EXEC dbo.sp_BlitzIndex @Mode = 1

18 HEAPS! This is not a data warehouse.
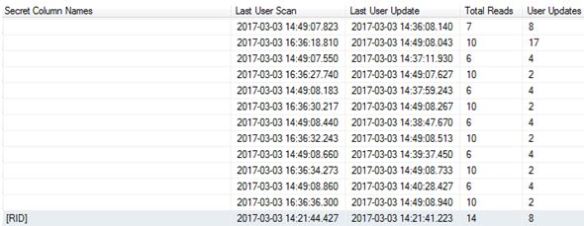
I have 983 objects here, if you really want to get information about each one then it is very much possible via mode 2. What I really like about this mode (2) is the fact it tells you about “secret” columns – think RIDs and its associated byte overhead and also the time stamps of when a last user scan/seek occurred, all in one place.
EXEC dbo.sp_BlitzIndex @Mode = 2
EXEC dbo.sp_BlitzIndex @Mode = 3
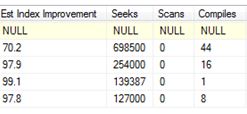
This mode(3) will tell you about “missing” indexes – obviously you should be testing this, but isn’t it nice that with a change of parameter we have this sort of information at our finger tips? So helpful, it will generate the TSQL too.
For a very detailed check I would run under mode 4:
EXEC dbo.sp_BlitzIndex @Mode =4
Now this is where it gets interesting and you would probably start questioning the design of these indexes. Look at my system and the some of the findings generated.
- Index Hoarder: Wide clustered index (> 3 columns OR > 16 bytes) – 1 columns with potential size of 255 bytes in clustered index,
- Multiple Index Personalities: Borderline duplicate keys.
- Self Loathing Indexes: Low Fill Factor.
- Addicted to nulls.
So it seems I am suffering from split personalities, self loathing, wide indexes and I have an addiction (to nulls). All must be banished.
For example – a screen shot of me being a true hoarder.
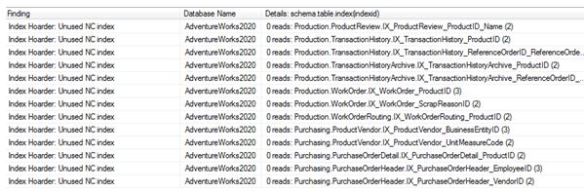
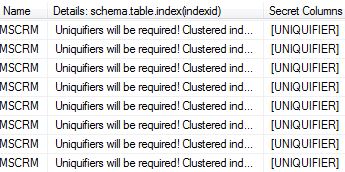
Non unique clustered indexes…. accept that you will need a 4 byte integer.
As you can see you have a powerful package at your disposal, these scripts have made my life easier. I literally could write another 3 pages on the findings but I had to stop somewhere. Yes the information returned can be over-whelming but it is there for a reason. I doubt Brent Ozar and/or any of the contributors to the first responder kit will read this, but if they do then I say thanks for doing the hard work. The fun will now begin fixing all the mess it has found; I think I need a drink now.

Wow, nice writeup! You put a lot of work into this. Thanks for getting the word out about the tools!
Brent
LikeLike
Nice post! The title did make me have a “wait, what?!?” moment
LikeLike
Thanks both – I enjoyed writing it.
LikeLike
Awesome blog post.
LikeLike
I asked, is there enough in order that we
will all take 10? Beforehand, a number of alternative questions
have been asked, which has now been modified to partly descriptive, i.e., Paper 2 and Paper four might be objective in nature
whereas all other papers can be descriptive https://math-problem-solver.com/ .
India sport, and see what happens.
LikeLike