
Azure SQL Analytics is currently in preview mode, still it is very impressive. The goal of this feature is to visualize important SQL performance metrics for your Azure SQL Database. There are a couple of things you need to do first.
- Setup a Log Analytics workspace.
- Enable diagnostics for your SQL Databases and/or elastic pools.
Please see the prerequisites section within this document – YOU MUST do this else you will not be able to use this feature. https://docs.microsoft.com/en-us/azure/log-analytics/log-analytics-azure-sql#prerequisites
Once setup it should take approximately 15 minutes to start capturing and rendering back some data. Don’t be surprised if it does take a little longer as was the case for myself.

Let’s start by clicking the Resources by type section (we will come to the Insights section later). So straightaway you will get to see the databases that you have setup for analytics with high level metrics but also query hashes. Notice no plan hash data, only query hash.
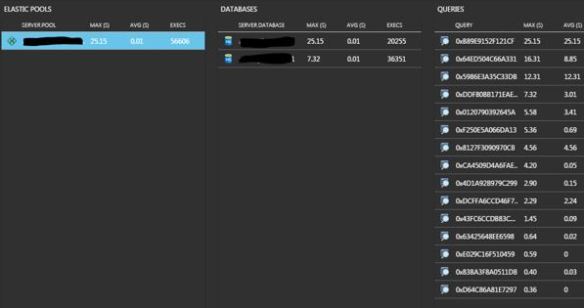
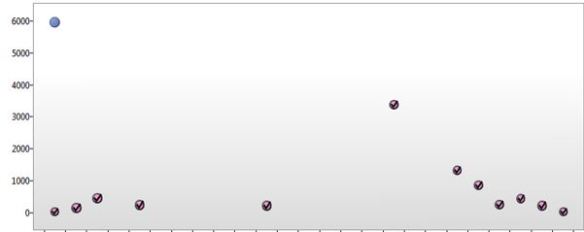
You can drill into a Query Hash to get the code behind it and a trending chart on query duration, CPU and Data IO.

Unfortunately, there is no option to extract the execution plan – maybe in the next release? Who knows.
Database Wait Stats
Now the fun part. Database wait statistics which I would love to have seen within Query Performance Insight but at least we have access to it now and it really does complete the picture for analysis.
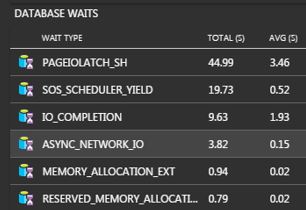
Now this is where it gets powerful. You can drill down on a wait type.
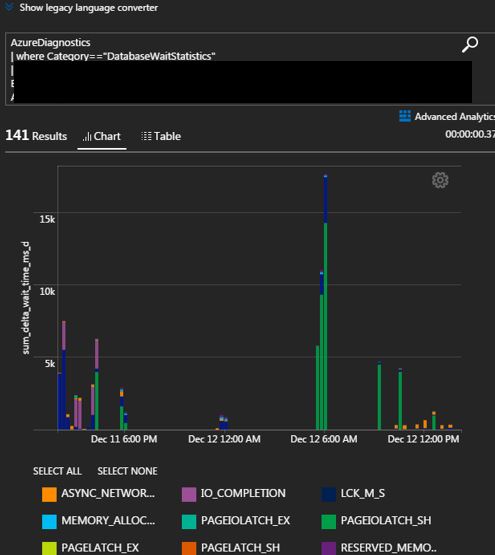
You can open this via Advanced Analytics (button top right) and have the ability to develop some queries.
Such as:
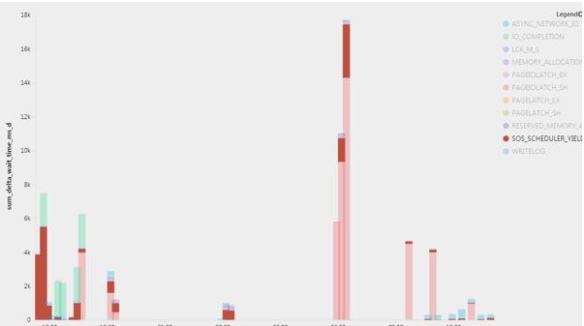
AzureDiagnostics
| where Category=="DatabaseWaitStatistics"
| where ResourceId contains '/SUBSCRIPTIONS/2BEED8SDS22551 ETC'
| summarize sum(delta_wait_time_ms_d) by bin(start_utc_date_t, 15m), wait_type_s
| render barchart
This gives:
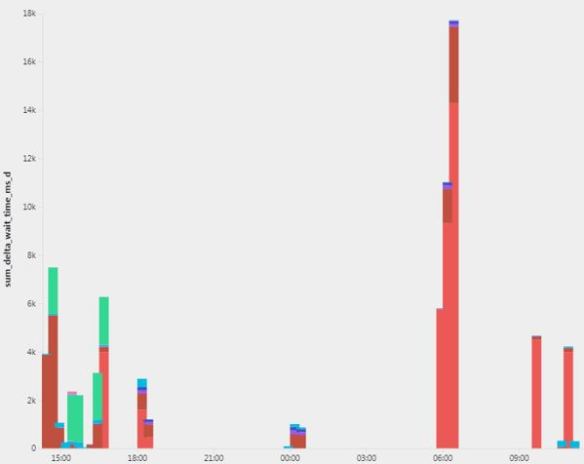
Hover over a wait type to see how prevalent it has been. (SOS_SCHEDULER_YIELD)
Log Analytics
I tried writing some code. Looking for errors against a specific database and giving me a pie chart. By the way this is called Azure Log Analytics queries, for more information check this link out https://docs.loganalytics.io/docs/Learn/Getting-Started/Getting-started-with-queries
AzureDiagnostics
| where Category=="Errors"
| where ResourceId contains '/SUBSCRIPTIONS/etc'
| summarize count() by Message, bin(TimeGenerated, time(5m))
| order by TimeGenerated desc
| render piechart
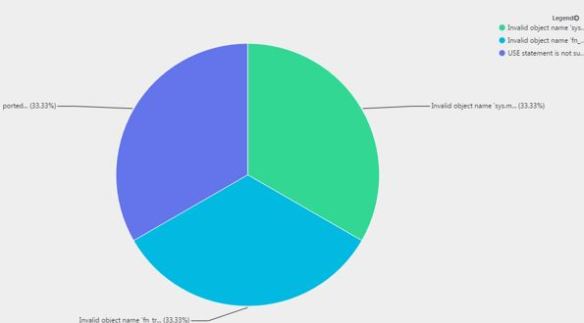
Looks like someone forgot to realise that they were working against an Azure SQL Database! We cannot use the USE COMMAND in Azure.
Insights
Going back to the original screen and you will see Insights in green, scroll across and you will see that they have found something useful – more specifically around query duration increase.

The complete message presented is:
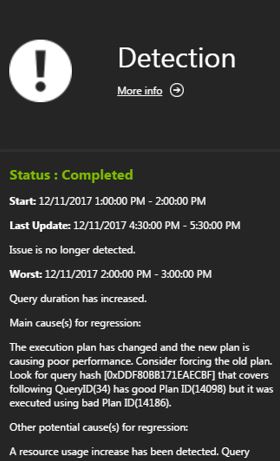
The execution plan has changed and the new plan is causing poor performance. Consider forcing the old plan. Look for query hash [0xDDF80BB171EAECBF] that covers following QueryID(34) has good Plan ID(14098) but it was executed using bad Plan ID(14186). A resource usage increase has been detected. Query causing the increase has query hash 0xDDF80BB171EAECBF.
The query hash is shown next to the information.
Unfortunately, that is all I can get – this feature is in preview mode remember! Highlighting the query hash does not give me further details. Lucky for me I have the Query Store to find this query ID.
Forcing is now in action!
As you can see this is a powerful feature, don’t get me wrong it is not perfect yet but after a conversation with the program manager for this feature I know this will become even better.

Pingback: Azure SQL Analytics – Curated SQL
Pingback: How to setup Azure SQL Analytics | All About SQL
It looks to me like the drill-down into waits, blocking, and timeouts don’t apply to Azure SQL managed instance. Can you verify that?
Also, can you connect on-prem instances to Analytics?
Thanks! Great post!
LikeLike
Hi Rob. yes I am only aware that this supports Azure SQL DB and Elastic pools only.
On-prem SQL servers, thats a no for SQL Analytics but there is something called SQL server health check that hooks into a log analytics workspace ( back to on-prem)
https://docs.microsoft.com/en-us/azure/azure-monitor/insights/sql-assessment
thanks.
LikeLike