
The query store, sounds familiar? The idea of the black box sitting within the database server watching what is going on within the environment. This is available within MySQL, maybe not as feature rich as SQL Server but still useful.
You will find this option under the Query performance insight section of your MySQL server.
First thing you need to do is confirm the status of the server parameter. It needs to be enabled.
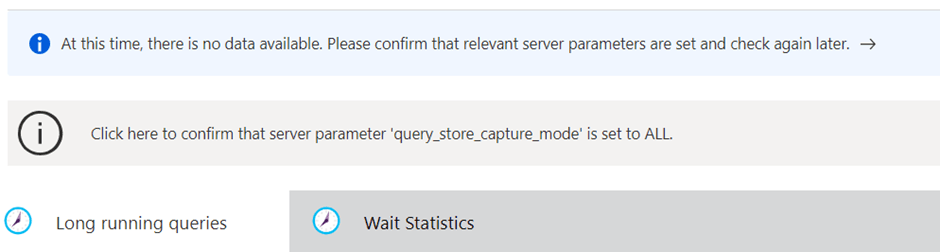
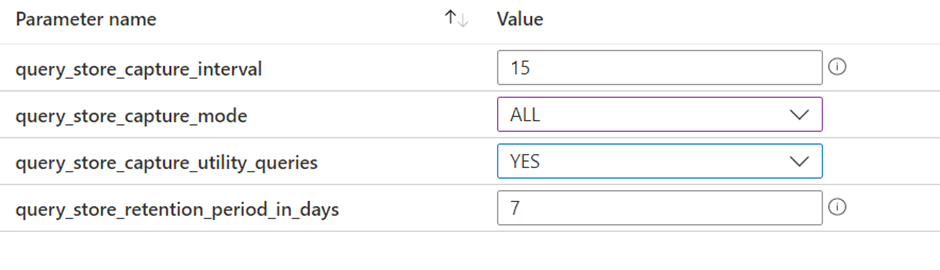
You can do this via the portal.
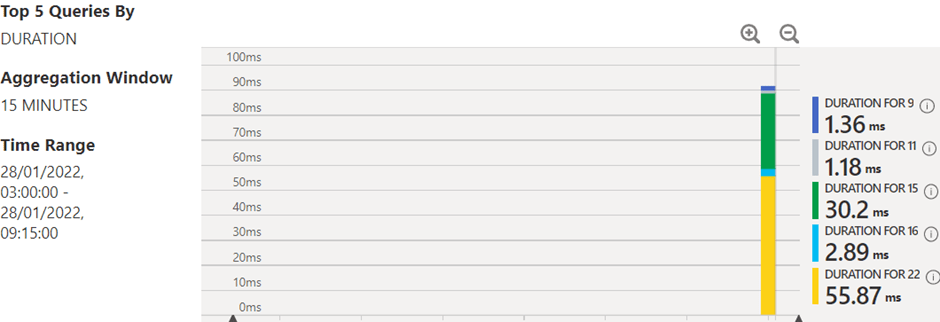
Once there is activity query store will start tracking data.
Important note – Wait statistics should not be enabled during peak workload hours or be turned on indefinitely for sensitive workloads.
Going back to performance analysis, it’s a good start. The next phase I expect from MS is the ability to natively drill down to get the query plan / text rather than manually stitching things together. If you need this information then grab the ID from the Azure portal and connect to MySQL and run:
SELECT * FROM mysql.query_store where query_id = 15Using the ID from the Azure portal, such as:
In MySQL the query looks like:
MySQL [ourdb]> SELECT * FROM mysql.query_store where query_id = 15;

This is ugly, so terminate with \G rather than;
MySQL [ourdb]> SELECT * FROM mysql.query_store where query_id = 15\G

If you decided to track wait stats then the following query would like:
MySQL [ourdb]> SELECT * FROM mysql.query_store_wait_stats where query_id = 15\G (only retained for 24 hrs).

Pingback: Dew Drop – March 3, 2022 (#3634) – Morning Dew by Alvin Ashcraft