“What exactly did it do on my server?” is the first question a DBA should ask about any AI agent. AgentDBA answers it from its own records: every decision in a run is written down with who made it, the reason given, what came back and how long it took.
I call it the flight recorder. This post replays one complete health check from those records, using two queries against the agent’s own database.
Two columns matter before any detail. One says how many of the six decisions the model made. The other says who closed the run. An agent’s record should always separate what the AI chose from what code chose for it.
Six steps, replayed
The second result set is the recorder itself: one row per decision, in order.
Step
At (ms)
Decided by
Action
Reason given
1
22
code
db_status
Health check Phase A gate.
2
67
code
error_log
Health check Phase A gate.
3
2,698
LLM
backup_failures
Test whether the previously reported backup RPO breaches remain present
4
5,253
LLM
failed_jobs
Test whether previously disabled jobs remain disabled…
5
8,220
LLM
log_file_health
Check current log usage, truncation blockers, and VL…
6
11,227
LLM
CONCLUDE
Concluding: AREA51-AKS remains in breach of back…
Steps 1 and 2 were not the model’s call. Every health check opens with database status and the error log, and code makes both calls. Had either come back CRITICAL, the agent would have escalated straight away with no model involved. They came back HIGH and LOW, so the run carried on.
From step 3 the model chose, inside a fixed boundary. It had three checks left, each allowed once, and then one verdict to write. It controls the order and the wording, and it has to state a reason with every action.
Where the 11.2 seconds went
The five SQL checks took 413 milliseconds between them. Almost all of the other 10.8 seconds was the model deciding what to do next: four decisions at roughly two and a half to three seconds each. That split matters to a DBA.
From the verdict back to the evidence
Each tool step carries an audit_log_id. It points to one stored row holding two things: the raw resultset SQL Server returned, and the compact summary of it that the model was shown.
Here is the raw resultset stored behind step 3, audit ID 22016.
The model never sees the raw resultset. Each tool reduces its rows to a short, structured summary in ordinary code, and only that summary reaches the model. The raw rows are kept in the audit log, so a reviewer can check the agent’s conclusion against the data the tool actually read.
So a run can be followed end to end: the conclusion, every step that led to it, who decided each step, the reason the model gave, and the data behind it.
Trust or audit
I did not want to ask a DBA to take an AI agent’s word for anything on a production server. The recorder is my answer: one row per decision, kept in your own database, readable with a SELECT.
AgentDBA has a free evaluation at agentdba.ai if interested.
When the evidence names the database, it says so. When it doesn’t, it stops.
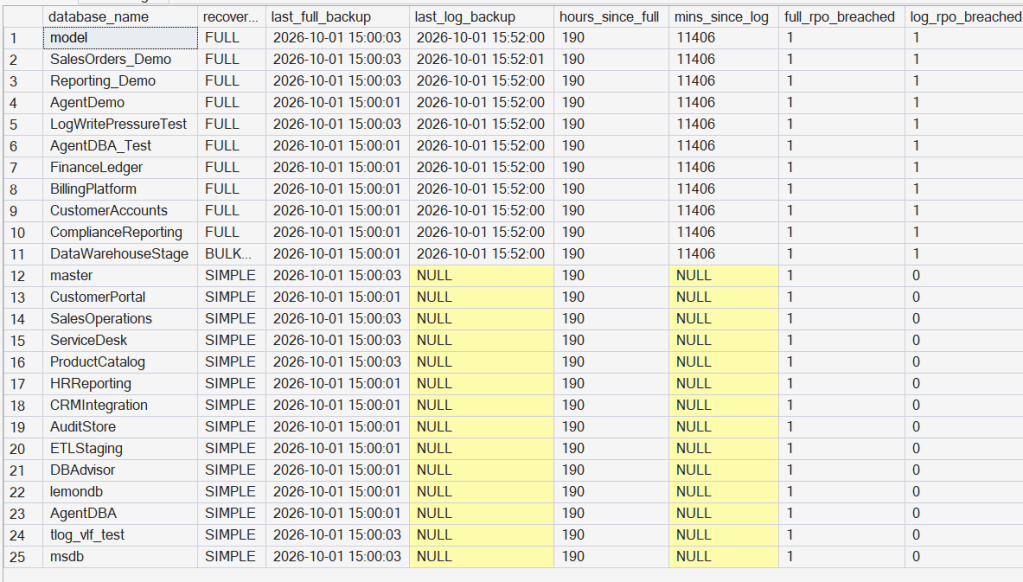
Three databases have no recorded full backup. One backup job failed. Many tools would link the two and call it solved. This one linked the job to one database and said the cause for the other two is not determined.
Transaction log issues are one of the quietest ways a healthy database turns into an incident. A log file fills up, backups fall behind, and by the time anyone notices it is a 2am page rather than a five-minute fix. AgentDBA runs against SQL Server and explains, in plain language, what is wrong and what to do about it. Below is a real example of it catching one.
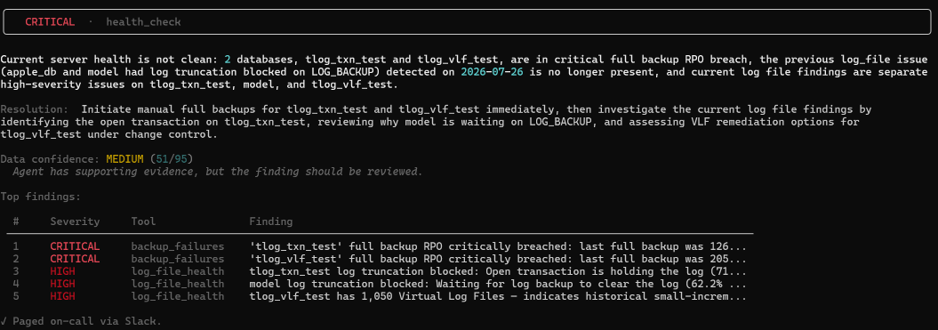
A routine full server check comes back CRITICAL. Two databases have blown through their backup RPO entirely (recovery point objective — how much data would be lost if a restore were needed right now), and three have separate high-severity transaction log problems. Instead of a wall of undifferentiated alerts, AgentDBA groups the findings, ranks them by severity, and attaches a confidence score (51/95, “has supporting evidence, but should be reviewed”) so the DBA knows exactly how much to trust the read before acting on it.
Following the evidence
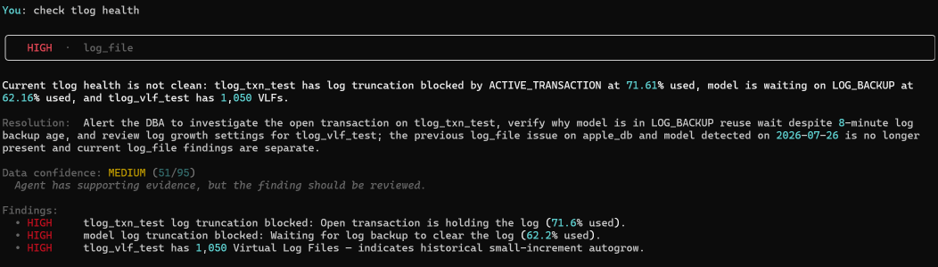
A quick follow-up question, “check tlog health,” drills straight into the detail: tlog_txn_test has an open transaction holding the log at 71.6% used, model is stuck waiting on a log backup, and tlog_vlf_test has 1,050 virtual log files — a telltale sign of small autogrow increments rather than a properly sized log. Each finding comes with a plain-English resolution, not just a symptom.
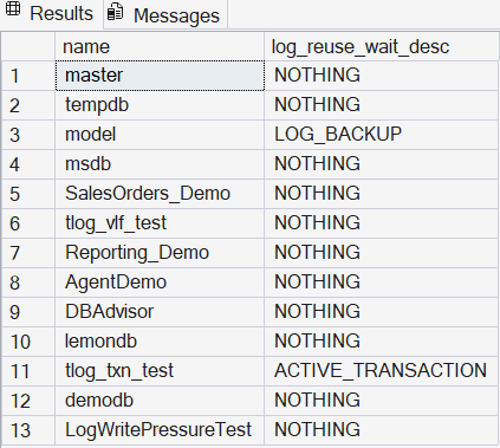
None of this is a guess. It is grounded in the same data a DBA would pull by hand — here, the log_reuse_wait_desc column straight from sys.databases, confirming the active transaction and the pending log backup wait.
Underlying evidence — verified directly against SQL Server, not inferred.
Connecting the dots
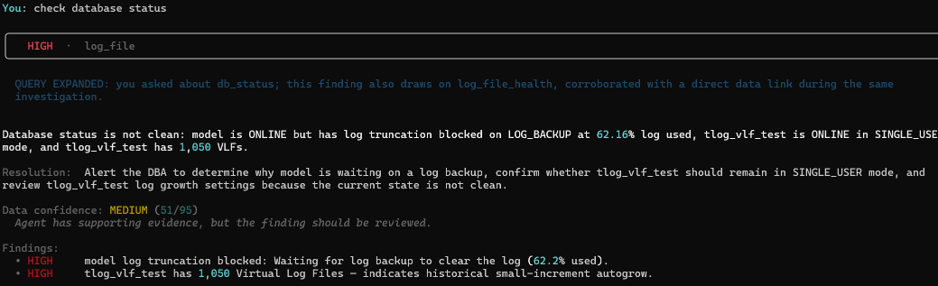
It also does this unprompted. Asking a separate question, “check database status,” pulls back the same underlying finding and says so explicitly: “you asked about db_status; this finding also draws on log_file_health, corroborated with a direct data link during the same investigation.” Rather than treating each question as a fresh, isolated lookup, it recognises the two are related and merges the evidence — so the DBA gets one coherent picture instead of having to cross reference two separate answers themselves.
Why this matters for DBAs
Time back: what is normally a 15–20 minute manual triage — checking sys.databases, log_reuse_wait_desc, VLF counts, and backup history separately — becomes a single question with a direct answer.
Trust, not blind faith: every finding ships with a confidence score and the underlying evidence, so the DBA can see why the agent believes what it believes rather than taking it on faith.
Connected context: findings link together across questions instead of resetting with every check, as shown above.
Every DBA has a box like this. Sitting untouched for months. Nobody’s proud of it, nobody’s fixed it, it’s just there — a handful of small compliance gaps that never made it to the top of anyone’s list.
I pointed AgentDBA at exactly that kind of instance. Then I made it worse on purpose.
Not every production incident is a database in RECOVERY_PENDING or a corrupted event (like the other post). Sometimes the server is just a mess. Jobs failing. Error log full of noise. Backups silently not running. No single catastrophic signal — just a slow accumulation of things going wrong that nobody has joined up yet. This is the other kind of scenario. No catastrophic signal to short-circuit on. AgentDBA reasons across all loaded modules and synthesises what it finds.
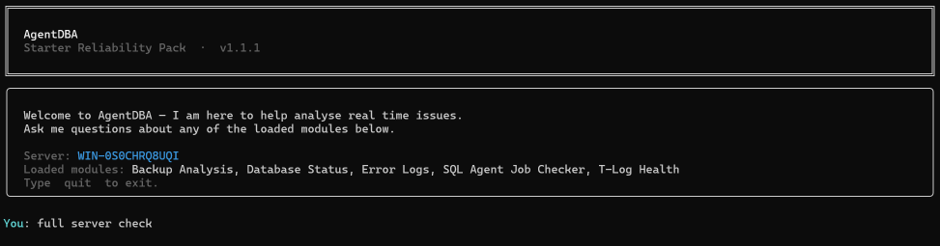
I connect AgentDBA to the server and type one thing. full server check
What comes back
The Agent sweeps across the loaded modules — backup analysis, database status, error logs, SQL Agent job checker, T-Log health — reasons across the findings and returns a single structured output.
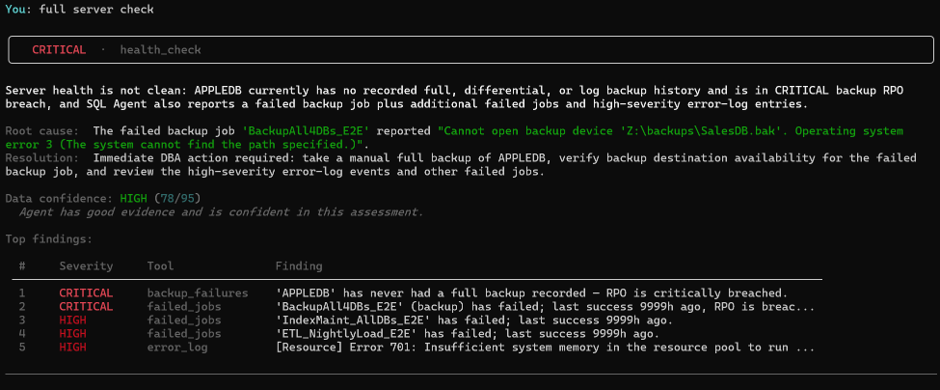
The banner is CRITICAL. The summary is precise: APPLEDB has never had a full backup recorded — the RPO is critically breached. The BackupAll4DBs_E2E job has failed, and the agent has already identified why: OS error 3 on Z:\backups\SalesDB.bak. The path doesn’t exist. Below that, two more failed jobs and high-severity error log entries ranked by severity.
Five findings. One output. Confidence scored at 78/95 — HIGH. The agent tells you it has good evidence and is confident in this assessment. It also tells you exactly what to do next.
This took seconds.
What shall I do?
I ask the obvious question.
The response is direct and specific. It does not say “investigate your backup jobs.” It says check BackupAll4DBs_E2E, verify the backup destination at Z:\backups\SalesDB.bak, and review error numbers 701, 802, 1101, 9002, and 17204 in the error log. It names the additional failed jobs that need separate review.
Every item on that list traces back to something a stored procedure returned. Nothing is inferred. Nothing is invented. If it is in the response, it came from the data.
The error log in isolation
Before I drill into the jobs, here is something worth showing. I call the error log module directly.
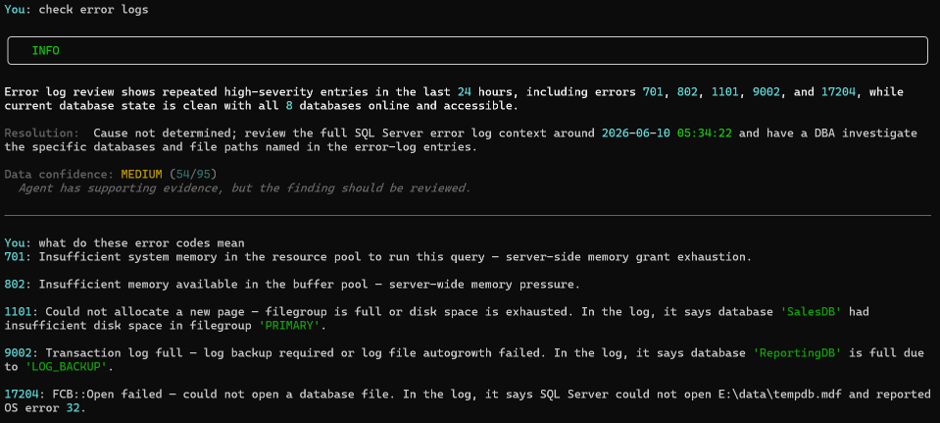
Notice two things. The banner is INFO, not CRITICAL. Confidence is 54/95 — MEDIUM. The agent has supporting evidence but explicitly says the cause is not determined from the error log alone and the finding should be reviewed. It will not promote a finding to CRITICAL just because the error numbers are serious. Without corroborating evidence from other modules it does not have enough to be certain
The agent doesn’t return generic textbook definitions. It returns contextualised explanations tied to what it saw in the log. Error 1101 — filegroup full — it tells me that was SalesDB, filegroup PRIMARY. Error 9002 — transaction log full — it tells me that was ReportingDB, cause LOG_BACKUP. Error 17204 — file open failure — it tells me that was E:\data\tempdb.mdf, OS error 32.
What this demonstrates
A noisy server is harder to read than a catastrophic one. One critical failure with a clear signal is straightforward. Five overlapping findings across jobs, backups, error logs with varying severities and a buried root cause, is where manual diagnosis costs time.
AgentDBA swept five modules, ranked the findings, identified a specific root cause backed by evidence from the job error message, scored its own confidence, and told me exactly what to fix — in one invocation.
The root cause claim isn’t a suggestion. Its evidence bound. OS error 3 on a specific path is in the data. That’s why the confidence is 78/95 and not lower — the agent knows what it can and cannot prove, and it tells you both.– more information can be found at http://www.agentDBA.ai