A nice little error log feature that I noticed in SQL Server 2016 regarding tempdb.
Tempdb settings in SQL Server
1

A nice little error log feature that I noticed in SQL Server 2016 regarding tempdb.
A nice little error log feature that I noticed in SQL Server 2016 regarding tempdb.
The great thing about new versions of SQL Server is the fact that they are packed full of new features but there some that don’t really get talked about much. I found out about a concept called lightweight query execution statistics profiling infrastructure – think of this as a way of capturing your “in-flight” query execution information, I did however encounter an issue which you will see later on.
Have you ever wanted to compare execution plans from SQL Server Management Studio? Well with the newer version of the software (SQL 2016 onward https://msdn.microsoft.com/en-us/library/mt238290.aspx) you can. Lets dive in.
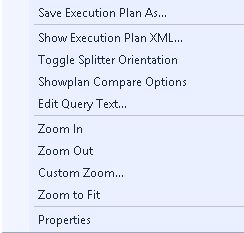
Once you have an execution plan ready right click on it and you will see the show plan compare option.
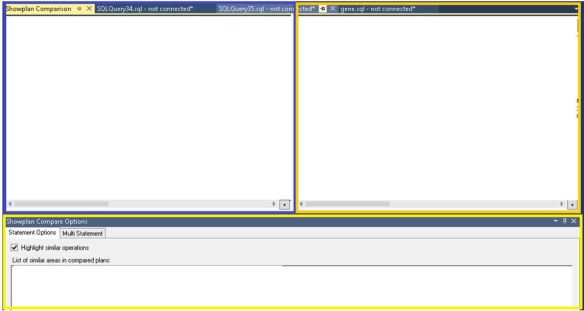
You will then need to navigate to the other execution plan that you want to compare. Ultimately they will then be “side by side” to allow for easy comparisons.
There are basically 3 windows to this, your top plan (blue box), bottom plan (orange box) and the options menu (yellow box).
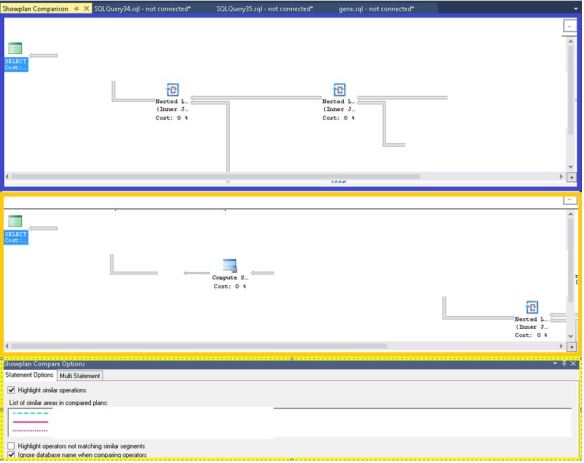
Or you can “toggle split” to change the orientation of the windows
As you can see in the yellow box I selected highlight similar operations, I then use the properties menu to see a high level comparison of the SELECT operator.
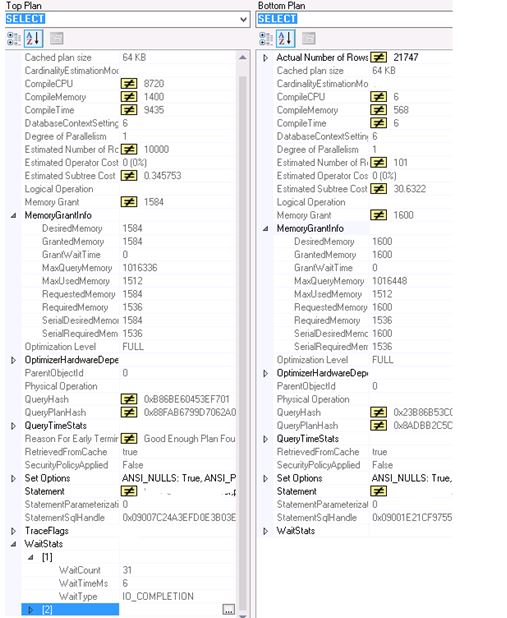
Notice the Wait stats information too? I thought that was pretty cool.
If you are interested in a certain operator that you want to compare you need to select it within both query plans and go to the properties window. Here I look at the hash match operator.

Then selecting the “highlight operators not matching similar segments” option you then will see where the execution plans differ. This was easy to see as the plan shape between the 2 plans was quite different.

This is a little feature that could prove quite handy.
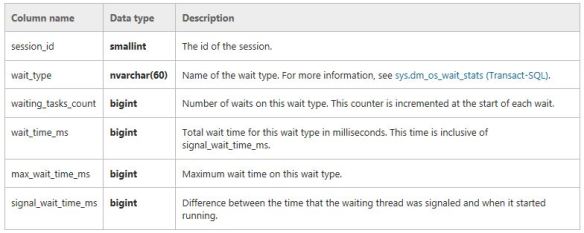
Wait statistics is a great place to start looking into performance issues. Normally people would issue commands/queries based on sys.dm_os_wait_stats and/or sys.dm_os_waiting_tasks. Did you know from SQL 2016 you have the ability to work with wait stats at a session level? This is done via sys.dm_exec_session_waits_stats. As stated by Microsoft documentation the “DMV resets the information for a session when the session is opened or when the session is reset” .
This is what is returned. The key bit here is the session_ID.
So let’s try and put this to use. Please note I use SQLskills queries written by Paul Randal for my wait stats analysis as shown here http://www.sqlskills.com/blogs/paul/wait-statistics-or-please-tell-me-where-it-hurts/, probably because that is where I learnt about the topic.
So I run a specific workload such as
DBCC CHECKDB ('AdventureWorks2016')
GO
Then I use the query from the above link which is based on sys.dm_os_wait_stats to check wait stats returning the following snippet (I did not clear anything out beforehand):
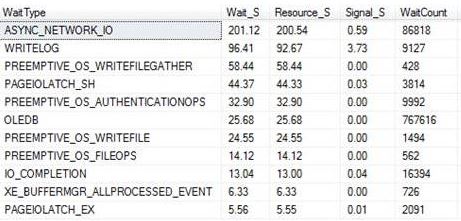
This tells me about the waits since my last reboot or since a manual reset of the stats. It’s probably why you should do at least time-based analysis or reset the wait stats before starting, that is if you are interested in something time specific or if you want to understand certain workloads at a given time.
So the other option is that you could go down the session level route. With the session based analysis I took the query and changed it slightly to query sys.dm_exec_session_wait_stats and also pull back the session_id that I am interested in.
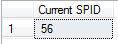
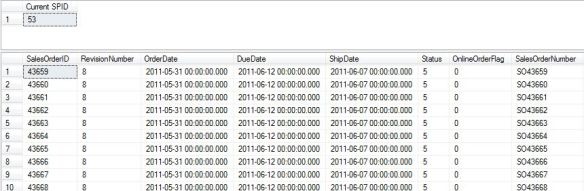
First thing is that I used the following to get an ID of interest. This was actually the connection for when I ran the CHECKDB command – SPID 56.
SELECT @@SPID AS [Current SPID]
I then use this ID within the WHERE clause of the query so I could track it to get session level wait stats.
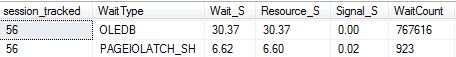
As you would expect it is very specific and quite relevant for the workload (CHECKDB) and for that moment in time only. Its definitely not a replacement technique for the other traditional ways but it could be something that you could use if you want to track a session ID real time.
Here is another example, this time tracking session_id 53 which is a big SELECT statement.
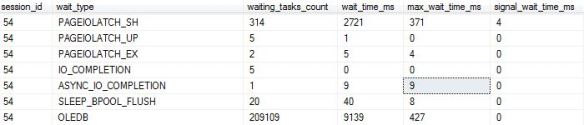
Session level waits:

Using the DMV in its most simplest form would return the following:
SELECT * FROM sys.dm_exec_session_wait_stats
WHERE session_id = 54
I guess you could even use sys.dm_exec_session_waits_stats to get some further details when/if you query sys.dm_exec_sessions or anywhere else where you can join onto the session_id, such as:
SELECT
s.program_name,s.login_time,s.database_id, cws.wait_type,cws.wait_time_ms
FROM sys.dm_exec_session_wait_stats AS cws
JOIN sys.dm_exec_sessions AS s
ON cws.session_id = s.session_id
WHERE cws.session_id = 54
ORDER BY wait_time_ms DESC
Snippet:

