Have you heard of SQLskills? Have you heard of the waits library? If not then where have you been hiding?
SQL Server Wait Types Library – UPGRADED!
Reply

Have you heard of SQLskills? Have you heard of the waits library? If not then where have you been hiding?
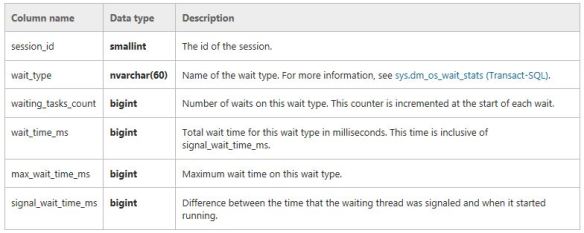
Wait statistics is a great place to start looking into performance issues. Normally people would issue commands/queries based on sys.dm_os_wait_stats and/or sys.dm_os_waiting_tasks. Did you know from SQL 2016 you have the ability to work with wait stats at a session level? This is done via sys.dm_exec_session_waits_stats. As stated by Microsoft documentation the “DMV resets the information for a session when the session is opened or when the session is reset” .
This is what is returned. The key bit here is the session_ID.
So let’s try and put this to use. Please note I use SQLskills queries written by Paul Randal for my wait stats analysis as shown here http://www.sqlskills.com/blogs/paul/wait-statistics-or-please-tell-me-where-it-hurts/, probably because that is where I learnt about the topic.
So I run a specific workload such as
DBCC CHECKDB ('AdventureWorks2016')
GO
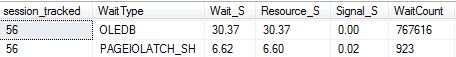
Then I use the query from the above link which is based on sys.dm_os_wait_stats to check wait stats returning the following snippet (I did not clear anything out beforehand):
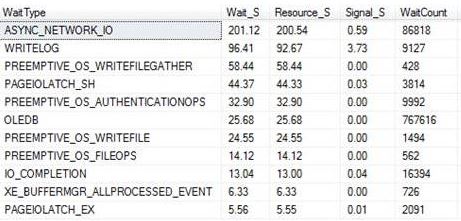
This tells me about the waits since my last reboot or since a manual reset of the stats. It’s probably why you should do at least time-based analysis or reset the wait stats before starting, that is if you are interested in something time specific or if you want to understand certain workloads at a given time.
So the other option is that you could go down the session level route. With the session based analysis I took the query and changed it slightly to query sys.dm_exec_session_wait_stats and also pull back the session_id that I am interested in.
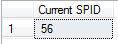
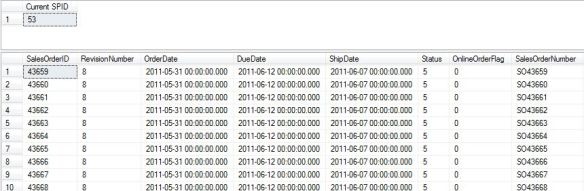
First thing is that I used the following to get an ID of interest. This was actually the connection for when I ran the CHECKDB command – SPID 56.
SELECT @@SPID AS [Current SPID]
I then use this ID within the WHERE clause of the query so I could track it to get session level wait stats.
As you would expect it is very specific and quite relevant for the workload (CHECKDB) and for that moment in time only. Its definitely not a replacement technique for the other traditional ways but it could be something that you could use if you want to track a session ID real time.
Here is another example, this time tracking session_id 53 which is a big SELECT statement.
Session level waits:

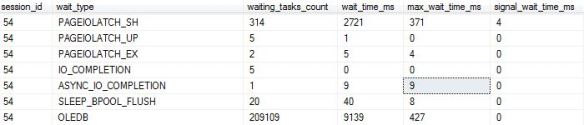
Using the DMV in its most simplest form would return the following:
SELECT * FROM sys.dm_exec_session_wait_stats
WHERE session_id = 54
I guess you could even use sys.dm_exec_session_waits_stats to get some further details when/if you query sys.dm_exec_sessions or anywhere else where you can join onto the session_id, such as:
SELECT
s.program_name,s.login_time,s.database_id, cws.wait_type,cws.wait_time_ms
FROM sys.dm_exec_session_wait_stats AS cws
JOIN sys.dm_exec_sessions AS s
ON cws.session_id = s.session_id
WHERE cws.session_id = 54
ORDER BY wait_time_ms DESC
Snippet:

Wait stats is my go to thing, however I do get bored just querying it via a table so I decided to broaden my horizons and see how “analytical” I could get with it via Power BI.
What I usually do is that I create a table and dump the contents of a famous waits stats script (*cough * Paul Randal, his code- NOT mine http://www.sqlskills.com/blogs/paul/wait-statistics-or-please-tell-me-where-it-hurts/) and all I do is put a timestamp on which I really want for time based analysis.
From there I can usually write some queries to see a trend – that is if one does exist.
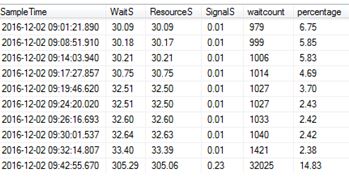
Something like:
select * from dbo.WaitQueues
where waittype ='IO_COMPLETION' order by SampleTime
Anyways, I want to see Power BI in use now – first you need to download the Desktop version and install it. From https://powerbi.microsoft.com/en-us/
Select Get Data to setup a connection to your table.

You should then be able to preview your data.

Once the data has been loaded you can get creative – I am not creative at all! So if you are a Power BI person I apologise in advance.
The first pie chart shows the Summary of my waits at a specific time.
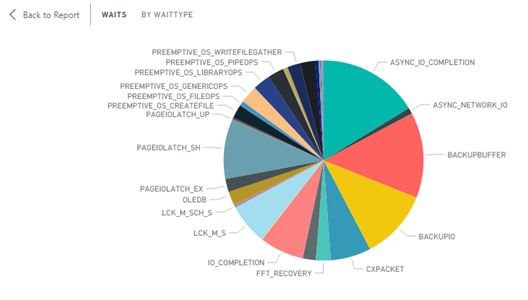
This is the pie chart at a different time point.

You can drill into a section of the pie chart to return the underlying details.

If you do not like using pie-charts you could switch to a tree map. This was me using CHECKDB heavily.

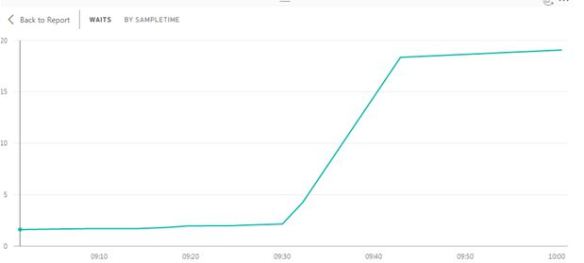
I wanted to see some visualization of what has happened to a specific wait over my time intervals.
For the below I selected WRITELOG over my time samples.

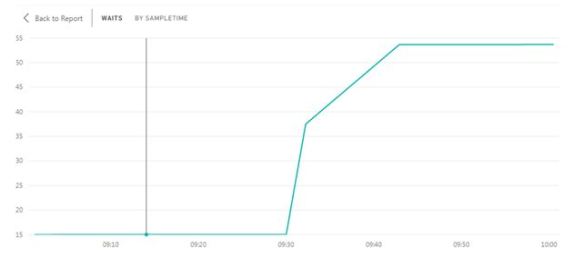
What about PAGEIOLATCH_EX?
What about CXPACKET analysis?
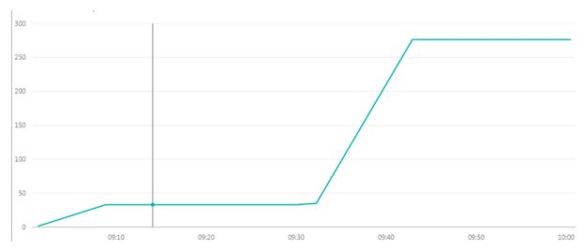
So what on earth happened at 930? Yes that was me going crazy with poor performing queries on a poor performing disk!
For the next example I decided to use a stacked bar chart looking at a selection of wait types only at a specific time interval. (9.08am)
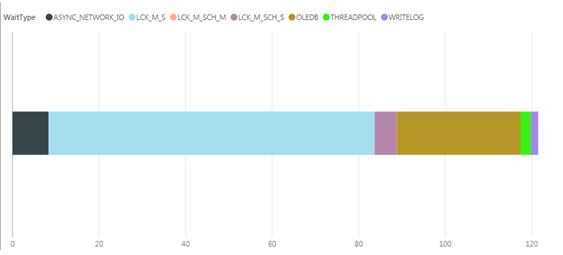
That light blue (I think) colour seems to take most of the chart, that being LCK_M_S – you can then drill into it for more details.

(Yes that is a link to the awesome sqlskills waits library, yep I helped gather some data for that)
Or if you prefer a standard bar chart can be used, below concentrates on Wait (S) per wait type encountered.
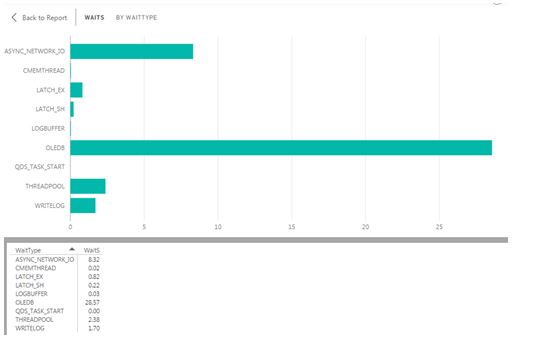
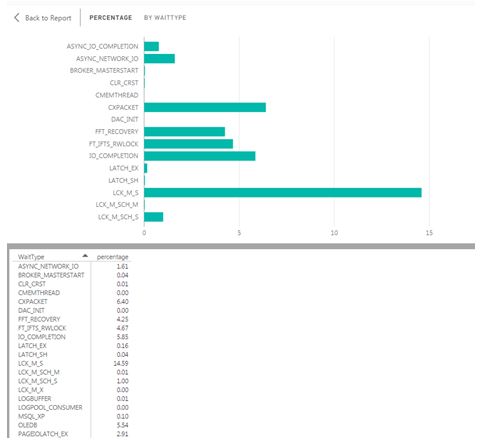
Or changing the filters you could go by percentage per wait type.
Finally I get slightly more creative with signal wait times (red).

I am really enjoying this sort of analysis; it is a nice change from writing queries. Give it ago!
Running the usual consistency checks on a database (with a new release code applied from an ISV) I noticed slower than usual timings. I started to dig into wait stats.
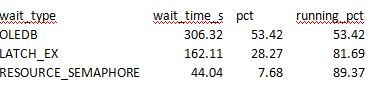
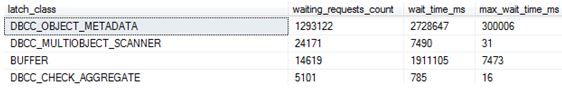
OLEDB I expected as that is what is used by CHECKDB under the covers. However LATCH_EX Wait was the 2nd highest on the list with high wait counts and high Avg_wait_S. I then decided to move into latch DMV and saw this.
SELECT * FROM sys.dm_os_latch_stats
ORDER BY waiting_requests_count desc
All the signs of CHECKDB Latch contention.
DBCC – OBJECT – METADATA this latch can be a major bottleneck for DBCC consistency checks when indexes on computed columns exist. As a side note DBCC_Multiobject scanner is used to get the next set of pages to process during a consistency check.
The call stack that I captured for DBCC – OBJECT – METADATA looked like:
XeSqlPkg::latch_suspend_end::Publish+e2 [ @ 0+0x0
LatchBase::Suspend+1002 [ @ 0+0x0
LatchBase::AcquireInternal+1ff [ @ 0+0x0
CheckCrossRowset::ProcessDataRecordInternal+3d1 [ @ 0+0x0
CheckCrossRowset::ProcessDataRecord+9c [ @ 0+0x0
CheckCrossRowset::ProcessRecord+a3 [ @ 0+0x0
CheckTables::ProcessDataPage+2af [ @ 0+0x0
CheckTables::ProcessPage+31c [ @ 0+0x0
CheckTables::ProcessNextData+297 [ @ 0+0x0
CheckAggregate::GetNextFact+113 [ @ 0+0x0
CTRowsetInstance::FGetNextRow+49 [ @ 0+0x0
CUtRowset::GetNextRows+7c [ @ 0+0x0
CQScanRmtScanNew::GetRowHelper+3e1 [ @ 0+0x0
CQScanXProducerNew::GetRowHelper+28f [ @ 0+0x0
FnProducerOpen+58 [ @ 0+0x0
FnProducerThread+4df [ @ 0+0x0</value>
For more information on what the above means see Paul’s Wait/Latch library for this type @ https://www.sqlskills.com/help/latches/dbcc_object_metadata/
I have captured call stacks many times to provide data for the library and it is alot of fun. (Maybe I need to get out more?)
When I disabled the indexes on the persisted computed columns I saw no LATCH based waits and the time taken to complete went down to literally couple of minutes(as opposed to 15) . Just having a glance into the latch DMV I did not see the DBCC – OBJECT – METADATA latch.
Oh the only thing to remember is to rebuild those indexes after the consistency check; I guess you could just offload the check to a different server if disabling is not a feasible option.
Great news from SQLskills.”Announcing the comprehensive SQL Server Wait Types and Latch Classes Library” – Paul S. Randal
It has been really fun contributing to these libraries and I am still trying to capture more data ( just hitting some issues at the moment).
Watch this space. These libraries are going to be huge!