The query store, Borko Novakovic Senior Program Manager from Microsoft calls this feature “Similar to an airplane’s flight data recorder”.
To get this setup there are some pre-Reqs needed. First you need the latest version of SSMS https://msdn.microsoft.com/library/mt238290.aspx – download it and install it. This blog post is just a whirl wind / high level post on query store, you could write a book on it.

Anyways, next comes the fun part – enabling it.
ALTER DATABASE [OURDB] SET QUERY_STORE = ON;
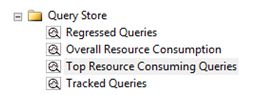
Why I said you need the latest version of SSMS is because it exposes the functionality via the GUI. You will see the query store node.
Once enabled you have a plethora of information at your finger tips – and I am really impressed with it. Now there is no real need to dig into the plan cache to get the information, or a need to run XML to parse data. It’s all here ready for use.
Beware of some default configuration options:
- The number of days to retain data in the query store. The default value is 30.
- The default value is 900 seconds (that is when data written to the query store is persisted to disk).
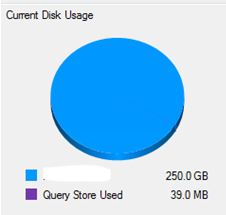
- MAX_STORAGE_SIZE_MB limit is 100MB
- Time interval at which runtime execution statistics data is aggregated into the query store. The default value is 60.
- SIZE_BASED_CLEANUP_MODE – this is whether or not the cleanup process will be automatically activated, auto is the default option.
- QUERY_CAPTURE_MODE for Azure the default is AUTO meaning ignore infrequent and queries with insignificant compile and execution duration
- MAX_PLANS_PER_QUERY = 200.
You can change these settings via SSMS under database properties.
Please Note: Query store data is stored within the host database.
Let’s have a look at “Top Resource consuming queries” option. This is just 1 area of analysis, as mentioned before there is alot of information within query store that you could analyse.
You have the ability to analyse the following metrics:
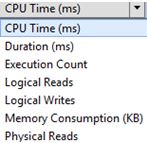
For this example I was looking at CPU (AVG).
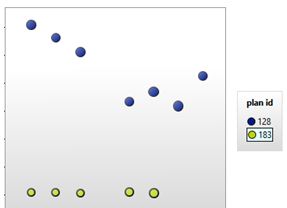
You have 3 windows presented (for this example)
- This is a bar chart showing you query id’s – usually you select one of interest
- Shows you the plan summary for that specfic query
- Will give you the execution plan for the above plan id.
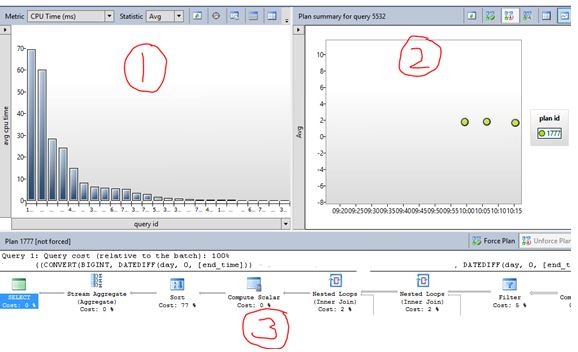
It’s so powerful you even have the option to FORCE a plan, something that you may want to consider before actually pressing that button. Saying that, I have the below situation – you know what I am going to do right?