
Whatever your database background is you will have heard of an execution / explain plan. Snowflake is no different. Coming from a MS SQL background I was used to reading plans from right to left. Now it is bottom to the top!
Enough talk let’s see one. I connect and issue a random query.
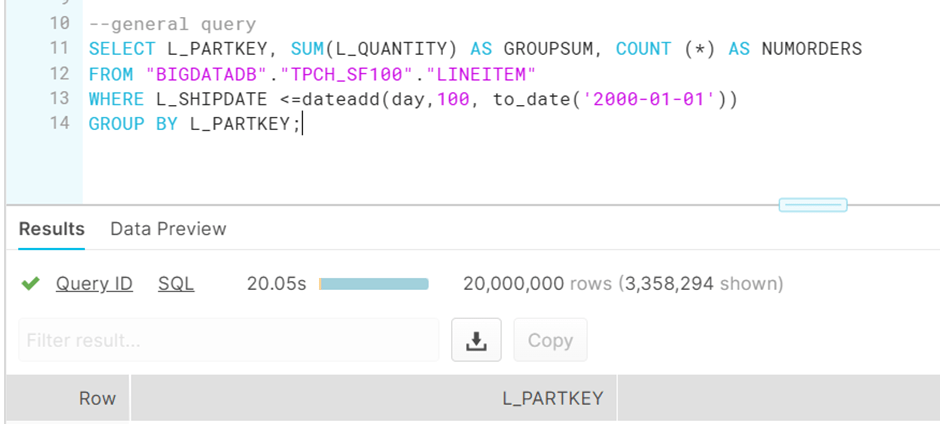
Where you see the tick and Query_ID link, click that and you will see the query ID to drill into.

20 seconds, 20 million rows, 2.3GB worth of scanned data ( no query result cache entry here)

Not exactly efficient in terms of partition pruning but that’s for another day.

Pingback: Showing a Query Plan in Snowflake – Curated SQL