
For this blog post I want to discuss the meaning behind SQL Server: Memory Manager\Target Server Memory (KB) and SQL Server: Memory Manager \Total memory (KB) Perfmon counters. I will mention how under different situations and configuration settings their behaviour changes.
Target Server Memory (KB) is the amount of memory that SQL Server is willing (potential) to allocate to the buffer pool under its current load. Total Server Memory (KB) is what SQL currently has allocated.
Using SQL Server 2014 developer edition (64 bit) my machine has 12GB RAM and maximum server memory is currently set to 8GB and for the purpose of this post I have set minimum server memory to 1GB (Lock Pages in Memory has not been set).

I set minimum to 1GB to dispel a myth, that SQL Server doesn’t allocate this value at start-up. Just before 08:17:44 the instance was restarted and the time after that the value is still below the 1GB setting (see blue line). Once it goes beyond the 1GB value it will not release memory below that value.

Currently SQL Server is consuming slightly less than 4GB.
Relating this to Perfmon Total server memory is the blue line (currently allocated) and Target server memory is the pink line (SQL’s potential for allocation).
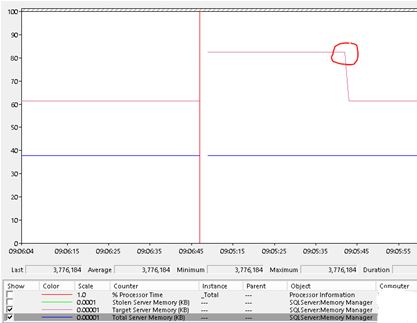
So Perfmon looks like the following.

So what happens if I change the max server setting down to 6GB? The Target Server Memory counter drops to 6GB (Pink line). As you can see via the red circle it happens.
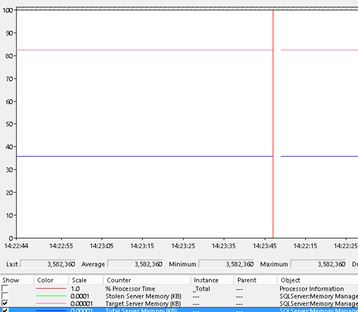
So what happens if I start using SQL Server more actively ? I will see the blue line move closer to the pink line.

Below shows what Perfmon looks like an hour later.

I am now going to set a bad configuration for Max Server memory setting.

SQL adjusts to this request where you can see a big dip in both target and total memory.

I am going to make things even worse and allocate less than 1GB for the max server memory setting and let normal activity resume. Checking the resource monitor ring buffer we can see that RESOURCE_MEMPHYSICAL_LOW notifications have been generated, this is a form of memory pressure.

Setting the Max memory value back to an acceptable value (8GB) – you will see the Perfmon counters respond to the change by trying to grow.

After general usage takes place the total and target memory counters look like as shown below.
I will now reset the memory settings as shown below.

Next I created external pressure by activating heavy memory consuming applications on the SQL Server – look at the Total server memory (and target) respond. It gets trimmed to its Min. Server setting of 1GB (black arrow).

Re-checking the resource monitor ring buffer you will see more RESOURCE_MEMPHYSICAL_LOW notifications but this time system wide (IndicatorsSystem = 2).

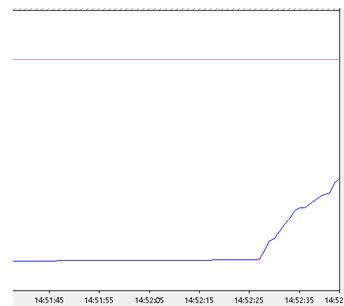
Once I stop the processes causing the external pressure the total server memory becomes the Low memory setting (1GB), this will change once SQL Server becomes actively used.

So some activity takes place – the blue line adjusts accordingly and goes beyond the 1GB setting.
After couple more minutes of activity the end picture looks similar to our starting point.

Hopefully this article has made it clearer about what Target and Total Perfmon counters are and how they respond to different situations and settings.
Thanks to Gail Shaw for the technical review

Pingback: SQL Server Target vs Total Memory - SQL Server Blog - SQL Server - Toad World
Pingback: SQL Server Memory Metrics | All About SQL
Pingback: SQL Server Target vs Total Memory – Toad World Blog
Pingback: What perfmon metric will help me to monitor whether the SQL server memory is under pressure and resulting in usage of page file on disk?