
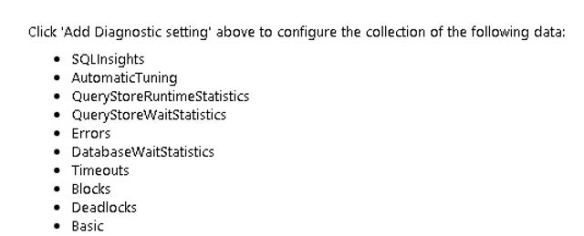
This is all about enabling diagnostics telemetry for Azure SQL databases. For Azure SQL Database there are quite a few options to select from. Below shows the diagnostic settings available.
Once you click add, you will see that you can output the information to 3 locations. Storage account, log analytics or an event hub. I usually opt for log analytics.
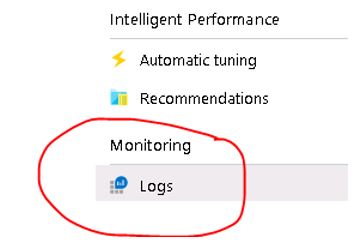
If you go this route you must make sure that you have a log analytics workspace already created. Once you have selected the settings you want, go to the log analytics workspace within logs.
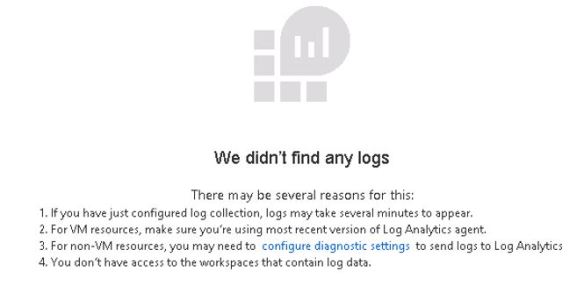
The below message is quite common, so be patient.
A New language is needed here. Called KQL – Kusto Query Language which basically is read only requests to process data. Not that I know much about it because I dont. Reminds me of SQL, hence the QL in KQL.
// Common categories in Azure diagnostics
// Count the number of logs reported per category
AzureDiagnostics
| summarize countLogsPerCategory=count() by Category
| sort by countLogsPerCategory

Pingback: Dew Drop – June 10, 2020 (#3215) | Morning Dew