You are probably wondering what this is, quite honestly I was wondering too. Well it is an extended events session known as telemetry_xevents that is shipped with SQL Server 2016. This is not the same as the system_health session that we have come to know and love, it captures very different information.
There are a lot of queries within this blog post but I think you will find them really useful because getting practical with it is the best way to show everyone what it is all about.
You can see the telemetry_xevents session via SSMS (SQL Server Management Studio).
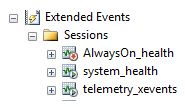
The script definition of telemetry_xevents is massive but I think it is important to show what it captures.
CREATE EVENT SESSION [telemetry_xevents] ON SERVER
ADD EVENT qds.query_store_db_diagnostics,
ADD EVENT sqlserver.always_encrypted_query_count,
ADD EVENT sqlserver.auto_stats,
ADD EVENT sqlserver.column_store_index_build_low_memory,
ADD EVENT sqlserver.column_store_index_build_throttle,
ADD EVENT sqlserver.columnstore_delete_buffer_flush_failed,
ADD EVENT sqlserver.columnstore_delta_rowgroup_closed,
ADD EVENT sqlserver.columnstore_index_reorg_failed,
ADD EVENT sqlserver.columnstore_log_exception,
ADD EVENT sqlserver.columnstore_rowgroup_merge_failed,
ADD EVENT sqlserver.columnstore_tuple_mover_delete_buffer_truncate_timed_out,
ADD EVENT sqlserver.columnstore_tuple_mover_end_compress,
ADD EVENT sqlserver.data_masking_ddl_column_definition,
ADD EVENT sqlserver.data_masking_traffic,
ADD EVENT sqlserver.data_masking_traffic_masked_only,
ADD EVENT sqlserver.database_cmptlevel_change,
ADD EVENT sqlserver.database_created,
ADD EVENT sqlserver.database_dropped,
ADD EVENT sqlserver.error_reported(
WHERE ([severity]>=(16) OR ([error_number]=(18456) OR [error_number]=(17803) OR [error_number]=(701) OR [error_number]=(802) OR [error_number]=(8645) OR [error_number]=(8651) OR [error_number]=(8657) OR [error_number]=(8902) OR [error_number]=(41354) OR [error_number]=(41355) OR [error_number]=(41367) OR [error_number]=(41384) OR [error_number]=(41336) OR [error_number]=(41309) OR [error_number]=(41312) OR [error_number]=(41313)))),
ADD EVENT sqlserver.json_function_compiled(
ACTION(sqlserver.database_id)),
ADD EVENT sqlserver.missing_column_statistics,
ADD EVENT sqlserver.missing_join_predicate,
ADD EVENT sqlserver.natively_compiled_module_inefficiency_detected,
ADD EVENT sqlserver.natively_compiled_proc_slow_parameter_passing,
ADD EVENT sqlserver.query_memory_grant_blocking,
ADD EVENT sqlserver.reason_many_foreign_keys_operator_not_used,
ADD EVENT sqlserver.rls_query_count,
ADD EVENT sqlserver.sequence_function_used(
ACTION(sqlserver.database_id)),
ADD EVENT sqlserver.server_memory_change,
ADD EVENT sqlserver.server_start_stop,
ADD EVENT sqlserver.stretch_database_disable_completed,
ADD EVENT sqlserver.stretch_database_enable_completed,
ADD EVENT sqlserver.stretch_database_reauthorize_completed,
ADD EVENT sqlserver.stretch_index_reconciliation_codegen_completed,
ADD EVENT sqlserver.stretch_remote_column_execution_completed,
ADD EVENT sqlserver.stretch_remote_column_reconciliation_codegen_completed,
ADD EVENT sqlserver.stretch_remote_index_execution_completed,
ADD EVENT sqlserver.stretch_table_alter_ddl,
ADD EVENT sqlserver.stretch_table_codegen_completed,
ADD EVENT sqlserver.stretch_table_create_ddl,
ADD EVENT sqlserver.stretch_table_data_reconciliation_results_event,
ADD EVENT sqlserver.stretch_table_hinted_admin_delete_event,
ADD EVENT sqlserver.stretch_table_hinted_admin_update_event,
ADD EVENT sqlserver.stretch_table_predicate_not_specified,
ADD EVENT sqlserver.stretch_table_predicate_specified,
ADD EVENT sqlserver.stretch_table_query_error,
ADD EVENT sqlserver.stretch_table_remote_creation_completed,
ADD EVENT sqlserver.stretch_table_row_migration_results_event,
ADD EVENT sqlserver.stretch_table_row_unmigration_results_event,
ADD EVENT sqlserver.stretch_table_unprovision_completed,
ADD EVENT sqlserver.stretch_table_validation_error,
ADD EVENT sqlserver.string_escape_compiled(
ACTION(sqlserver.database_id)),
ADD EVENT sqlserver.temporal_ddl_period_add,
ADD EVENT sqlserver.temporal_ddl_period_drop,
ADD EVENT sqlserver.temporal_ddl_schema_check_fail,
ADD EVENT sqlserver.temporal_ddl_system_versioning,
ADD EVENT sqlserver.temporal_dml_transaction_fail,
ADD EVENT sqlserver.window_function_used(
ACTION(sqlserver.database_id)),
ADD EVENT sqlserver.xtp_alter_table,
ADD EVENT sqlserver.xtp_db_delete_only_mode_updatedhktrimlsn,
ADD EVENT sqlserver.xtp_stgif_container_added,
ADD EVENT sqlserver.xtp_stgif_container_deleted,
ADD EVENT XtpCompile.cl_duration,
ADD EVENT XtpEngine.parallel_alter_stats,
ADD EVENT XtpEngine.serial_alter_stats,
ADD EVENT XtpEngine.xtp_db_delete_only_mode_enter,
ADD EVENT XtpEngine.xtp_db_delete_only_mode_exit,
ADD EVENT XtpEngine.xtp_db_delete_only_mode_update,
ADD EVENT XtpEngine.xtp_physical_db_restarted
ADD TARGET package0.ring_buffer(SET occurrence_number=(100))
WITH (MAX_MEMORY=4096 KB,EVENT_RETENTION_MODE=ALLOW_SINGLE_EVENT_LOSS,MAX_DISPATCH_LATENCY=120 SECONDS,MAX_EVENT_SIZE=0 KB,MEMORY_PARTITION_MODE=NONE,TRACK_CAUSALITY=OFF,STARTUP_STATE=ON)
GO
As you can see it is very different when comparing it to the system health session and more importantly there is no XEL file target, querying the ring buffer is quite different.
To see things at a high level you would run the following basic query.
DECLARE @ShredMe XML;
SELECT @ShredMe = CAST(target_data AS XML)
FROM sys.dm_xe_sessions AS s
JOIN sys.dm_xe_session_targets AS t
ON t.event_session_address = s.address
WHERE s.name = N'telemetry_xevents';

SELECT
qp.query('.') AS event_data
FROM @ShredMe.nodes('RingBufferTarget/event') AS q(qp);

It’s much better if we can shred the XML to be more specific. I gave it a go using XQuery because I had a lot of the auto_stats events.
DECLARE @ShredMe XML;
SELECT @ShredMe = CAST(target_data AS XML)
FROM sys.dm_xe_sessions AS s
JOIN sys.dm_xe_session_targets AS t
ON t.event_session_address = s.address
WHERE s.name = N'telemetry_xevents';

SELECT
QP.value('(@timestamp)[1]', 'datetime2') AS [timestamp logged],
QP.value('(data[@name="database_id"]/value)[1]', 'INT') as [DatabaseID],
QP.value('(data[@name="object_id"]/value)[1]', 'INT') as [ObjectID],
QP.value('(data[@name="index_id"]/value)[1]', 'INT') as [IndexID],
QP.value('(data[@name="job_type"]/text)[1]', 'VARCHAR(MAX)') as [Job Type],
QP.value('(data[@name="statistics_list"]/value)[1]', 'VARCHAR(MAX)') as [Stats List]
FROM @ShredMe.nodes('RingBufferTarget/event[@name=''auto_stats'']') AS q(QP);
GO

Looking at the above you can see that you have the ability to get a time when a stats object has been created,loaded and/or updated.
I think there is great information available here, I started to dig in more.
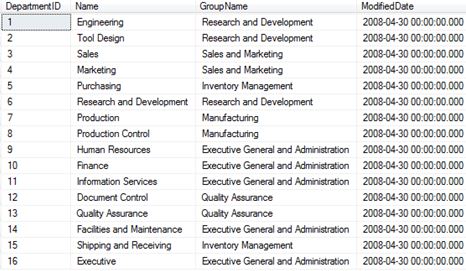
Example 1
I am going to find database creation times. I created couple of databases and then issued the following query:
DECLARE @ShredMe XML;
SELECT @ShredMe = CAST(target_data AS XML)
FROM sys.dm_xe_sessions AS s
JOIN sys.dm_xe_session_targets AS t
ON t.event_session_address = s.address
WHERE s.name = N'telemetry_xevents';

SELECT
QP.value('(data[@name="database_name"]/value)[1]', 'varchar(20)') as [DatabaseName],
QP.value('(@timestamp)[1]', 'datetime2') AS [timestamp created]

FROM @ShredMe.nodes('RingBufferTarget/event[@name=''database_created'']') AS q(QP);

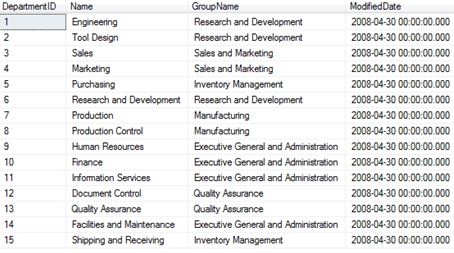
Example 2
How about finding when the compatibility level of a database changed?
DECLARE @ShredMe XML;
SELECT @ShredMe = CAST(target_data AS XML)
FROM sys.dm_xe_sessions AS s
JOIN sys.dm_xe_session_targets AS t
ON t.event_session_address = s.address
WHERE s.name = N'telemetry_xevents';

SELECT
QP.value('(data[@name="database_id"]/value)[1]', 'INT') as [DatabaseID],
QP.value('(@timestamp)[1]', 'datetime2') AS [timestamp of change],
QP.value('(data[@name="previous_value"]/value)[1]', 'INT') as [Previous cmptlevel],
QP.value('(data[@name="new_value"]/value)[1]', 'INT') as [Newcmptlevel]

FROM @ShredMe.nodes('RingBufferTarget/event[@name=''database_cmptlevel_change'']') AS q(QP);

Example 3
Finding the times when a database was dropped.
DECLARE @ShredMe XML;
SELECT @ShredMe = CAST(target_data AS XML)
FROM sys.dm_xe_sessions AS s
JOIN sys.dm_xe_session_targets AS t
ON t.event_session_address = s.address
WHERE s.name = N'telemetry_xevents';

SELECT
QP.value('(data[@name="database_name"]/value)[1]', 'varchar(20)') as [DatabaseName],
QP.value('(@timestamp)[1]', 'datetime2') AS [timestamp when dropped]
FROM @ShredMe.nodes('RingBufferTarget/event[@name=''database_dropped'']') AS q(QP);

Example 4
Memory change tracking.
DECLARE @ShredMe XML;
SELECT @ShredMe = CAST(target_data AS XML)
FROM sys.dm_xe_sessions AS s
JOIN sys.dm_xe_session_targets AS t
ON t.event_session_address = s.address
WHERE s.name = N'telemetry_xevents';
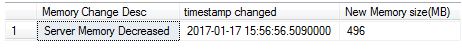
SELECT
QP.value('(data[@name="memory_change"]/text)[1]', 'varchar(256)') as [Memory Change Desc],
QP.value('(@timestamp)[1]', 'datetime2') AS [timestamp changed],
QP.value('(data[@name="new_memory_size_mb"]/value)[1]', 'int') as [New Memory size(MB)]
FROM @ShredMe.nodes('RingBufferTarget/event[@name=''server_memory_change'']') AS q(QP);

After playing with the memory settings I then received the below:
Example 5
Checking if someone created a temporal table, then you can use the ID (which I labelled it as TableId) and find it in sys.tables.
DECLARE @ShredMe XML;
SELECT @ShredMe = CAST(target_data AS XML)
FROM sys.dm_xe_sessions AS s
JOIN sys.dm_xe_session_targets AS t
ON t.event_session_address = s.address
WHERE s.name = N'telemetry_xevents';

SELECT
QP.value('(data[@name="database_id"]/value)[1]', 'INT') as [DatabaseID],
QP.value('(data[@name="table_id"]/value)[1]', 'BIGINT') as [TableID],
QP.value('(@timestamp)[1]', 'datetime2') AS [timestamp created temporal DDL],
QP.value('(data[@name="period_type"]/text)[1]', 'varchar(20)') as [Type]
FROM @ShredMe.nodes('RingBufferTarget/event[@name=''temporal_ddl_period_add'']') AS q(QP);

As mentioned you can then confirm the name of the table via the below query:
select * from sys.tables
where object_id = 645577338

Example 6
Finally I check for error messages greater than level 16.
DECLARE @ShredMe XML;
SELECT @ShredMe = CAST(target_data AS XML)
FROM sys.dm_xe_sessions AS s
JOIN sys.dm_xe_session_targets AS t
ON t.event_session_address = s.address
WHERE s.name = N'telemetry_xevents';

SELECT
QP.value('(data[@name="severity"]/value)[1]', 'INT') as [severity level],
QP.value('(@timestamp)[1]', 'datetime2') AS [timestamp logged],
QP.value('(data[@name="message"]/value)[1]', 'VARCHAR(MAX)') as [Message]
FROM @ShredMe.nodes('RingBufferTarget/event[@name=''error_reported'']') AS q(QP);
GO

The queries you can build to get information are endless.
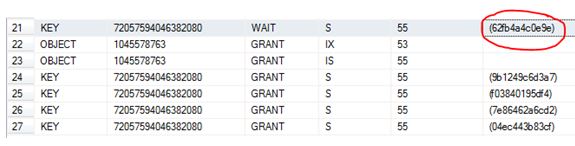
As a side not I did get missing join predicate warnings but the XML didn’t really return anything for me to query.
Do not forget about the drawbacks. The ring buffer isn’t perfect, if anything I found it quite annoying. It has a maximum amount of memory in kilobytes (KB) to use that being 4096 and 100 occurrences which means the preferred number of events of each type to keep in the buffer. After a restart the information will be lost.