Clearing Plan Cache in SQL Database (Azure)

Sometimes when in a testing mode I do like to clear cache within my SQL database (Azure). Nowadays a lot of my test databases are Azure based so how I clear cache is different to how I would do it with an older “earthed” SQL Server.

Looking at my locally installed SQL Server.


SELECT @@VERSION

cold

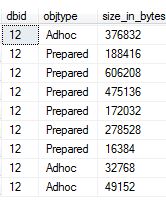
Getting some basic information about the cache for a specific database.

 SELECT st.dbid, cp.objtype, cp.size_in_bytes
FROM sys.dm_exec_cached_plans AS cp
CROSS APPLY sys.dm_exec_sql_text(cp.plan_handle) st
WHERE dbid = 12
OPTION (RECOMPILE);

cold1.JPG

Normally I would run:

-- Database_ID
DBCC FLUSHPROCINDB (12);

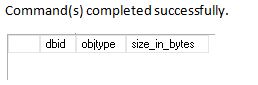
I have cleared it out.

cold2

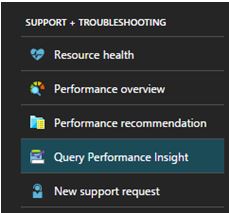
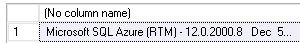
So, lets go to the Azure world.


SELECT @@VERSION

cold3.JPG

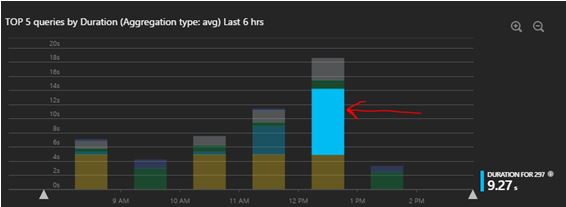
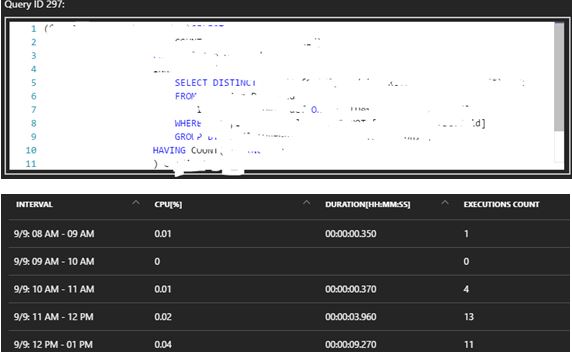
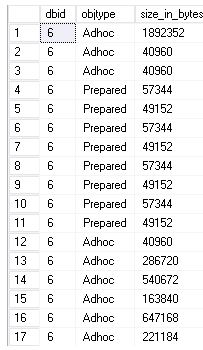
Again, get some basic information for my database ID.

SELECT st.dbid, cp.objtype, cp.size_in_bytes
FROM sys.dm_exec_cached_plans AS cp
CROSS APPLY sys.dm_exec_sql_text(cp.plan_handle) st
WHERE dbid = 6
OPTION (RECOMPILE);

cold5.JPG

-- Database_ID
DBCC FLUSHPROCINDB (6);

Just does not happen: Msg 15247, Level 16, State 14, Line 9
User does not have permission to perform this action – I am not sure what permission I need? I am logging in as a server admin.

So I used the following instead.

ALTER DATABASE SCOPED CONFIGURATION CLEAR PROCEDURE_CACHE ;

cold4.JPG

Locking Resources in Azure

I look at locking resources within Azure as a safety mechanism where it can protect users from accidental deletion, it can get quite confusing within the portal if for example you have close to 100 databases.

There are 2 types of lock resources in Azure.

  • Delete – Obviously you can’t delete but you can read / modify a resource, this applies to authorised users.
  • ReadOnly – Authorised users can read a resource but they cannot edit or delete it.

For this blog post I create a delete lock on one of my SQL Databases. Under the settings of your SQL database you will see the LOCKS option.

port

You will then want to click ADD.

port1

That’s it – let’s put it to a test

Message from the portal:

The lock named NoDel was unable to be added or edited for the following reasons: {“jqXHR”:{“readyState”:4,”responseText”:”{\”error\”:{\”code\”:\”AuthorizationFailed\”,\”message\”:\”The client does not have authorization to perform action ‘Microsoft.Authorization/locks/write’ over scope

Well, that is not what I want! You must be Owner or User Access Administrator.

 Once you have addressed the permission issues just click OK.

port2


You know how the saying goes – An ounce of prevention is worth a pound of cure.

Copying your SQL Database

If you have created a SQL Database in Azure (PaaS) and need to make a copy of it on the same server I will show you how via a quick method.

When connected to your master database execute the following: It creates SAP2 based on SAP.

CREATE DATABASE SAP2 AS COPY OF SAP
 

To track the progress you can use the following query.

SELECT * FROM sys.dm_database_copies
WHERE partner_database = 'SAP2'
 

as

Replication state 1 means seeding, this means that the SAP2 database has not yet completely synchronised with the original database. 0 means pending, which means that the copy is being prepared.

Once this has completed you can check sys.databases to confirm that the database has successful been created.

SELECT * FROM sys.databases
WHERE name = 'SAP2'
 

as1

If you really want you can query sys.dm_operation_status to see the operations that have been performed on a database. I would expect to see some sort of operation around copying on my original database.

SELECT * FROM sys.dm_operation_status   WHERE major_resource_id = 'SAP'
ORDER BY start_time DESC;
 

as3.JPG

If you are interested in other Azure based SQL queries check out an older post of mine: https://blobeater.wordpress.com/2016/10/18/azure-sql-database-dmvs/


Query Performance Insight

It is really easy getting insight into Query performance within your Azure SQL DB. I think Microsoft have done a good job with the User Interaction and with the information provided – even though I would have liked to see a metric type on I/O. Never the less lets dig in.

On you Azure DB under support and troubleshooting click on Query Performance Insight.

query1

Here you will be presented with the TOP X queries based on CPU, Duration or Execution count. You will have the ability to change the time period of analysis, return 5, 10 or 20 queries using aggregations SUM, MAX or AVG.

So let’s look at what information is provided based on queries with high AVG duration over the last 6 hours.

query2

Once you have highlighted the section on the bar chart that interests you (red arrow), you will be presented with the duration time for that query ID. For this it is query ID 297 that had an Avg duration of 9.27S.

query3

So you can then click the 297 ID button to dig in deeper where you can get the Query text and get timed interval analysis.

query4

Now, there is a “recommendation” button – here you can have the ability to even automate index maintenance, personally this isn’t something I would automate – I would like to see what they recommend and analyse it myself.

query5

Pretty powerful (and colourful) stuff available at your finger tips.

UPDATE: 6TH OCTOBER 2016 – I have been contacted by Microsoft Query Performance Insight PM where he kindly informed me that I/O is now tracked (if you recall at the start of the article it was something that I would’ve loved to see – now I can ).

So back in the Query Performance Insight menu – you will see Data IO and Log IO.

data1

You will now have the ability to see a line graph to see a trend (if it exists) for these new metrics.

8200

Then as mentioned before you would correlate this back to the Query ID to understand the TSQL being executed. So for this example I would dig into Query ID 8280.

qwer

It ended up being a pretty poor SELECT statement in much need of some optimization.