NOLOCK

NOLOCK, some say it’s a fast option for queries and will never cause blocking, I say it’s quite dirty and MAY cause blocking.

I used to think that a NOLOCK (which is the same as read uncommitted) hint actually meant that a “no lock” was used, I was very wrong and the naming doesn’t really help. Let’s have a look.

I will run a random SELECT statement with the hint, such as

SELECT * FROM Sales.BigSalesOrderDetailEnlarged WITH (NOLOCK)

Then I will check the “go to” DMV for locks.

SELECT resource_type, resource_associated_entity_id,
    request_status, request_mode,request_session_id,
    resource_description
    FROM sys.dm_tran_locks
    WHERE resource_database_id = 13

nolock

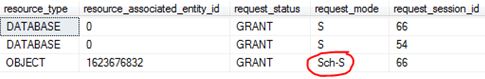
A Sch-S (schema stability) lock is taken.  This is a lightweight lock; the only lock that can conflict with this is a Sch-m (schema modification) lock. (C = Conflict). This means that a NOLOCK can actually block for example against an ALTER TABLE command.

nolock1

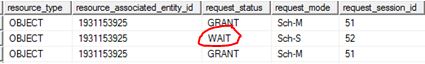
Below shows the example of when my NOLOCK query is being blocked by ALTER INDEX commands:

 SELECT resource_type, resource_associated_entity_id,
    request_status, request_mode,request_session_id,
    resource_description
    FROM sys.dm_tran_locks 

nolcok4

So there you go, it can be involved in blocking.

Dirty reads:

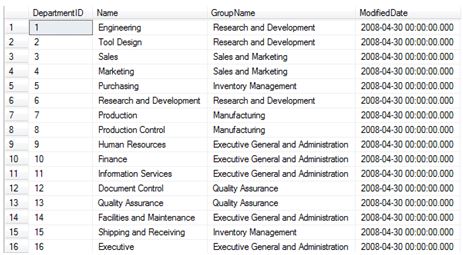
This is my example data.

nocok3.JPG

In Window 1 using SQL Server management Studio I begin an open UPDATE statement – notice that it has NOT been committed.

BEGIN TRAN
UPDATE [HumanResources].[Department]
SET Name = 'Global'
WHERE DepartmentID = 16

In window 2 I do a NOLOCK select statement.

SELECT * FROM HumanResources.Department (NOLOCK)
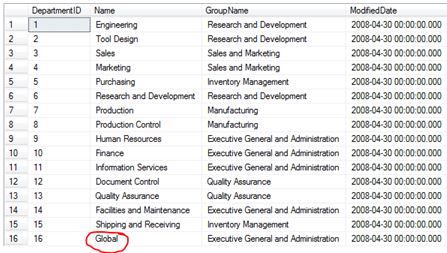
lockdffgsef.JPG

Now that’s dirty.

SQL Server – Playing With Trace Flags

Trace flags are used to temporarily set specific server characteristics or to switch off a particular behavior. They are usually scoped to a global level or a session only level. For this blog post I thought it would be handy to show you how to enable (and disable) global based trace flags and then check the status on your system.

The difference between global and session is important to understand, global trace flags are visible to every connection whereas session scoped means that the trace flag is visible to only that connection.

Global Scope

For this example I will be using a global trace flag that overrides the use of index hints (This is not something I do or encourage; it is just a use case for this post).


SELECT AddressID,city FROM [Person].[Address]
WHERE City = 'Albany'

I wrote a basic query because as you will see it gives me a Non-Clustered Index Seek.

index

I am now going to write a query where I will force the above SELECT statement to use an index where it really shouldn’t – the outcome is a scan with a key lookup – yep not what we want

SELECT AddressID,city FROM [Person].[Address]  WITH (INDEX (AK_Address_rowguid))
WHERE City = 'Albany'

index1

So let’s set a global based trace flag to say for any connection ignore ALL index hints. I would expect it to go back to an index seek. The -1 in the TRACEON is very important – that is what makes it global.

 DBCC TRACEON (8602,-1)

SELECT AddressID,city FROM [Person].[Address]  WITH (INDEX (AK_Address_rowguid))
WHERE City = 'Albany'

index3.JPG

So it’s clear to see that even with the index hint it is now ignored.

Because it’s global I then connected to the server as someone else and issued the query with the same results.

Check status

To check what trace flags are enabled on the system run the below.

DBCC TRACESTATUS (-1);
GO

index4

Turn off

DBCC TRACEOFF (8602,-1)

DBCC execution completed. If DBCC printed error messages, contact your system administrator.

DBCC TRACESTATUS(-1);
GO

Re-issuing the above DBCC TRACESTATUS will now show nothing.

What about after a restart?

I switched the trace flag back on then restarted SQL Service and issued the status command:

index6

DBCC TRACESTATUS(-1);

GO

DBCC execution completed. If DBCC printed error messages, contact your system administrator.

The flag has been lost.

SQL Server Configuration Manager

Personally I prefer using configuration manager if I am using trace flags. Under properties of your MSSQLSERVER you will see a start-up parameters tab.

index0

Click ADD.

index101

After you have restarted logon to the SQL Server and check the status

DBCC TRACESTATUS(-1);

GO

index45

I restarted the SQL service again just to prove that settings will be preserved – which they are and that is the part that I like about configuration manager.

sqlservr.exe

We all know what the sqlservr.exe and its importance, but have you noticed the size difference of the .exe when comparing SQL Server 2008R2 to SQL Server 2012 onwards?

Let’s look at 2008R2, I navigate to the BINN folder i.e. Program Files\Microsoft SQL Server\MSSQL10_50.MSSQLSERVER\MSSQL\Binn – it is around 61MB

lang.JPG

Navigating to my 2012 instance via Program Files\Microsoft SQL Server\MSSQL11.MSSQLSERVER\MSSQL\Binn it is 190KB.

lang2.JPG

I never really noticed the difference before, but I understand why.

From 2012 onwards the architecture changed, it has been broken up into multiple DLLs. I can see the extra DLL files within the BINN folder these being sqllang.dll and sqlmin.dll where each are roughly 30MB each.

lanmg3.JPG

While this post wont change your day to day job I was quite fascinated with the size difference. As a side point sqllang.dll it where Query Processing and execution facilities takes place and sqlmin.dll offers services such as checkpoint, lazywriter and lock monitor.

Task Manager is a liar

I remember asking a question at a recent training event, the outcome? I now don’t use task manager to try and understand how much memory SQL Server is consuming. Why? Well it has the ability to lie, and as you will see, it can lie really well. (Depending on settings)

Let’s look at my environment, SQL Server is running under Process ID 5548.

tasks.JPG

Right, so I am using 58% of my server memory and looking at SQL Server it is consuming approx. 105MB? Well, it’s not. It doesn’t make any sense.

Use resource monitor to really know what is going on.

Resource monitor shows:

tasks1

Why this is so inaccurate (for my case) is because of the use of Lock Pages in Memory – Task manager does not track memory that is allocated using the AllocateUserPhysicalPages() API which is what this setting does.

SQL Server Backup Compression

I thought that it would be handy to capture some Perfmon graphs of what happens to backup throughput and CPU on my SQL Server when I have backup compression on vs off against my 35GB database.

No compression

BACKUP DATABASE TATA TO DISK = 'd:\mylocation\DBNOTOCOMP.BAK' WITH COPY_ONLY,
STATS = 10

I will be using data collectors to show the perfmon counters(below) for the duration of the backup command – it just paints a better picture than running real time perfmon graphs.

% Processor Time

perf

Backup Throughput/sec

perf1

Overall Time & size

5.5 minutes to do:

perf3

With Compression

BACKUP DATABASE TATA TO DISK = ' d:\mylocation\DByesCOMP.BAK'
WITH COPY_ONLY, STATS = 10, COMPRESSION

Again Data collectors paint a nice picture for CPU and Backup Throughput.

% Processor Time

perf5

Backup Throughput/sec

perf6

Overall Time & size

2.5 minutes to do:

perf7

Findings

Some of the findings maybe obvious to you, having said that here is what I found:

  • Using backup compression uses more CPU. (My Average for %Processor Time went from 5.05 to 18.93)
  • A compressed backup is much smaller hence backup speed is much faster (nearly reduced the time taken by 50%).
  • Backup Throughput more than doubled when compressing.
  • Compression ratio does depend on many factors but my ratio was 2.88.

Trace Flag 3042

You can change the behaviour of the compressed backup. By default the Database Engine uses a pre-allocation algorithm for the backup file. For my example it pre-defined to the size of DByesCOMP.BAK = 4646286KB.

Using the trace flag you can see the change in behaviour. Instead it starts of from a low size and works its way up to the true final size.

DBCC TRACEON (3042)
BACKUP DATABASE TATA TO DISK = ' d:\mylocation\DByesCOMP1.BAK'
WITH COPY_ONLY, STATS = 10, COMPRESSION

perf8.JPG

I did find that using this trace flag made the backup operation slightly longer with a reduced throughput rate. I personally have no use for this trace flag but it was a new behaviour for me so I thought I would share it too.

perf10