I want to show you what happens when you keep using the undocumented fn_dump_dblog function. (For example if you are consistently dumping the contents into a table for analysis)
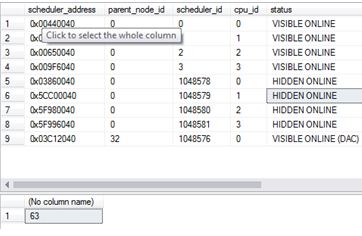
The below 2 queries shows the current state of my system
SELECT * FROM sys.dm_os_schedulers

SELECT COUNT(*) FROM sys.dm_os_threads
Now let’s just set the environment up and use fn_dump_dblog and see the effect of using it.
ALTER DATABASE [AdventureWorks2012DR] SET RECOVERY FULL
BACKUP DATABASE [AdventureWorks2012DR] TO DISK = 'C:\SQLSERVER\AdventureWorks2012DR.BAK'
GO
BACKUP LOG [AdventureWorks2012DR] TO DISK = 'C:\SQLSERVER\AdventureWorks2012DRLog.BAK'
GO
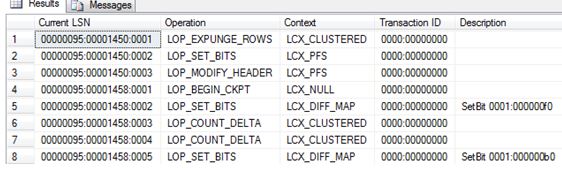
SELECT
[Current LSN],
[Operation],
[Context],
[Transaction ID],
[Description]
FROM
fn_dump_dblog (
NULL, NULL, N'DISK', 1, N'C:\SQLSERVER\AdventureWorks2012DRLog.BAK',
DEFAULT, DEFAULT, DEFAULT, DEFAULT, DEFAULT, DEFAULT, DEFAULT,
DEFAULT, DEFAULT, DEFAULT, DEFAULT, DEFAULT, DEFAULT, DEFAULT,
DEFAULT, DEFAULT, DEFAULT, DEFAULT, DEFAULT, DEFAULT, DEFAULT,
DEFAULT, DEFAULT, DEFAULT, DEFAULT, DEFAULT, DEFAULT, DEFAULT,
DEFAULT, DEFAULT, DEFAULT, DEFAULT, DEFAULT, DEFAULT, DEFAULT,
DEFAULT, DEFAULT, DEFAULT, DEFAULT, DEFAULT, DEFAULT, DEFAULT,
DEFAULT, DEFAULT, DEFAULT, DEFAULT, DEFAULT, DEFAULT, DEFAULT,
DEFAULT, DEFAULT, DEFAULT, DEFAULT, DEFAULT, DEFAULT, DEFAULT,
DEFAULT, DEFAULT, DEFAULT, DEFAULT, DEFAULT, DEFAULT, DEFAULT)
Ok so it returns some information – Great.
Let’s keep running the code (Movement into a table for future analysis). Look at the state of my system. After couple of hours:
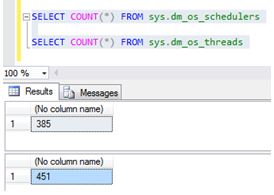
Using this command creates more threads and hidden schedulers (these will only go after a restart). Depending on what version of SQL Server you are on and what Service Pack you may or may not have this issue. It was fixed in SQL 2012 SP2 onwards. So be on the cautious side when running these sorts of commands.
Also I noticed Memory bloat for the sqlservr.exe. Nothing else was running on this server, just my fn_dump_dblog script. Threads need memory too. (Each thread will use 0.5MB on x86 and 2MB on x64)