Azure SQL Database scripts

I thought that this would be useful for others – couple of scripts that I have been using in Azure for my SQL Databases.

--************************--
-- Azure SQL DB Scripts--
--**************************

-- Wait Stats / Database
WITH Waits AS
(SELECT wait_type, wait_time_ms / 1000. AS wait_time_s,
100. * wait_time_ms / SUM(wait_time_ms) OVER() AS pct,
ROW_NUMBER() OVER(ORDER BY wait_time_ms DESC) AS rn
FROM sys.dm_db_wait_stats
)
SELECT W1.wait_type,
CAST(W1.wait_time_s AS DECIMAL(12, 2)) AS wait_time_s,
CAST(W1.pct AS DECIMAL(12, 2)) AS pct,
CAST(SUM(W2.pct) AS DECIMAL(12, 2)) AS running_pct
FROM Waits AS W1
INNER JOIN Waits AS W2
ON W2.rn <= W1.rn
GROUP BY W1.rn, W1.wait_type, W1.wait_time_s, W1.pct
HAVING SUM(W2.pct) - W1.pct < 99
-- Currently active sessions
SELECT
sys.dm_exec_sessions.session_id AS [Spid],
CASE is_user_process
WHEN 1
THEN 'User'
WHEN 0
THEN 'System'
END
AS [Session],
HOST_NAME,
PROGRAM_NAME,
login_name,
Status,
cpu_time ,
total_scheduled_time ,
total_elapsed_time
FROM sys.dm_db_session_space_usage INNER join sys.dm_exec_sessions
ON sys.dm_exec_sessions.session_id = sys.dm_db_session_space_usage.session_id

-- Returns information about operations performed on databases
-- Context of Master
SELECT * FROM sys.dm_operation_status
ORDER BY start_time

-- Returns CPU, I/O, and memory consumption for an Azure SQL Database
SELECT
AVG(avg_cpu_percent) AS 'Average CPU Utilization In Percent',
MAX(avg_cpu_percent) AS 'Maximum CPU Utilization In Percent',
AVG(avg_data_io_percent) AS 'Average Data IO In Percent',
MAX(avg_data_io_percent) AS 'Maximum Data IO In Percent',
AVG(avg_log_write_percent) AS 'Average Log Write Utilization In Percent',
MAX(avg_log_write_percent) AS 'Maximum Log Write Utilization In Percent',
AVG(avg_memory_usage_percent) AS 'Average Memory Usage In Percent',
MAX(avg_memory_usage_percent) AS 'Maximum Memory Usage In Percent'
FROM sys.dm_db_resource_stats;

--DTU usage tracked over Timed intervals
SELECT end_time,
(SELECT Max(v)
FROM (VALUES (avg_cpu_percent), (avg_data_io_percent), (avg_log_write_percent)) AS
value(v)) AS [avg_DTU %]
FROM sys.dm_db_resource_stats;
sys.dm_db_wait_stats DMV

Come on guys, lets “UP- vote” this suggestion for  the actual SQL Server product – even the “Scary DBA” likes the idea!

A way to analyse wait stats at the database level just like Azure SQL Database? Yes please….

https://connect.microsoft.com/SQLServer/feedback/details/2647332/sys-dm-db-wait-stats-dmv

Wait Types and Latch Classes Library

Great news from SQLskills.”Announcing the comprehensive SQL Server Wait Types and Latch Classes Library” – Paul S. Randal

http://www.sqlskills.com/blogs/paul/announcing-the-comprehensive-sql-server-wait-types-and-latch-classes-library/

It has been really fun contributing to these libraries and I am still trying to capture more data ( just hitting some issues at the moment).

Watch this space. These libraries are going to be huge!

Symbols

I just want to write the setup I went through for using debug symbols within SQL Server to resolve call stacks. At a high level this is what you need to do – Assuming that you are using 64 BIT software.

  • Download the debugger kit – I downloaded Windows Kit 8.1 http://www.microsoft.com/en-us/download/details.aspx?id=42273.This will get installed @ C:\Program Files\Windows Kits\8.1\Debuggers\
  • Using CMD you will then need to CD to the Microsoft Binn location – this will depend on the version you are using – for example SQL 2008 R2 =CD C:\Program Files\Microsoft SQL Server\MSSQL10_50.MSSQLSERVER\MSSQL\Binn
  • Then you will need to issue this command:”C:\Program Files\Windows Kits\8.1\Debuggers\x64\symchk” sqlservr.exe /s SRV*c:\symbols*http://msdl.microsoft.com/download/symbols
  • This will then pull down a sqlservr.pdb file (to your C drive) which then you should move to the SQL Server Binn location.
  • Repeat this but replace the sqlservr..exe with *dll hence:“C:\Program Files\Windows Kits\8.1\Debuggers\x64\symchk” *.dll /s SRV*c:\symbols*http://msdl.microsoft.com/download/symbols


That’s it! You will then be able to resolve call stacks.

You may have issues if you cut and paste from this article – usually it is the following  “ “ which you may need to enter manually.

An Extended Event script

I have been enjoying XE alot recently ( from following SQLSKILLS) so I decided to write something that I used recently – aim: find what process within a specific database that was causing ALTER / CREATE commands, again I am modifying the below for a test concept.

This is what I used:


CREATE EVENT SESSION [XE_tracker] ON SERVER
ADD EVENT  sqlserver.object_altered
(
    ACTION (sqlserver.database_id)
    WHERE  (sqlserver.database_id = 5) -- bound to my DB of interest
),

ADD EVENT  sqlserver.object_created
(
    ACTION (sqlserver.database_id)
    WHERE  (sqlserver.database_id = 5)
),
ADD EVENT sqlserver.sql_statement_completed(
     ACTION (sqlserver.database_id, sqlserver.plan_handle,
            sqlserver.session_id, sqlserver.sql_text)
			WHERE  (sqlserver.database_id = 5) 

			)
add target package0.asynchronous_file_target	-- Store events on disk
(
	set filename           = N'C:\sqlserver\tracker.xel',
		max_file_size      = 1024, /* MB */
		max_rollover_files = 4
)
go

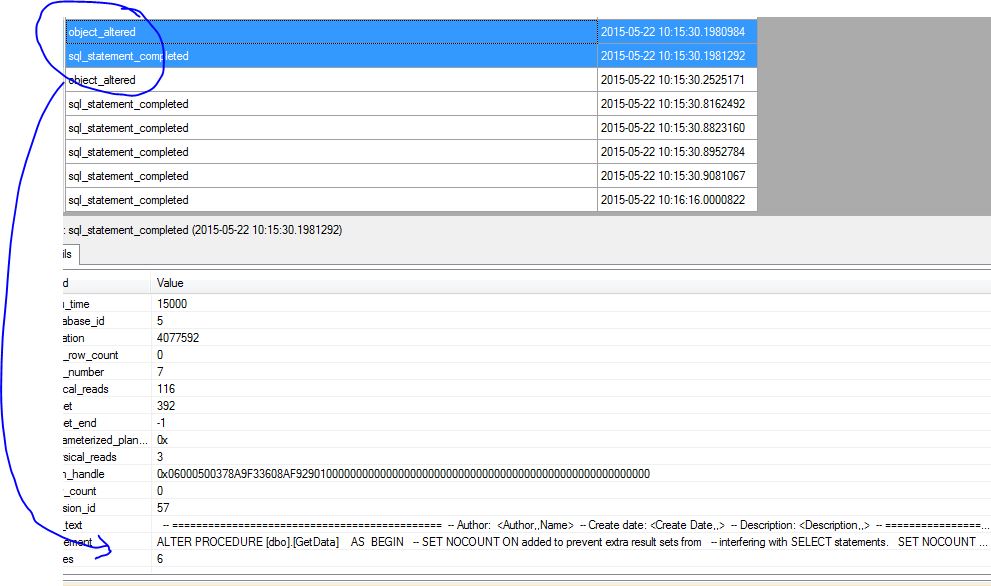
Then I could deduce what was happening – below showing ALTER command.

CaptureEE