Looking at wait stats differently with SQL 2016

Wait statistics is a great place to start looking into performance issues. Normally people would issue commands/queries based on  sys.dm_os_wait_stats and/or sys.dm_os_waiting_tasks. Did you know from SQL 2016 you have the ability to work with wait stats at a session level? This is done via sys.dm_exec_session_waits_stats. As stated by Microsoft documentation the “DMV resets the information for a session when the session is opened or when the session is reset” .

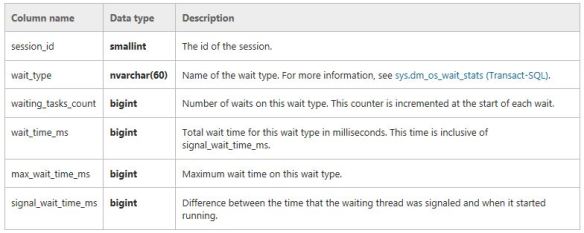
This is what is returned. The key bit here is the session_ID.

waitsdmv1

So let’s try and put this to use. Please note I use SQLskills queries written by Paul Randal for my wait stats analysis as shown here http://www.sqlskills.com/blogs/paul/wait-statistics-or-please-tell-me-where-it-hurts/, probably because that is where I learnt about the topic.

So I run a specific workload such as

DBCC CHECKDB ('AdventureWorks2016')
GO

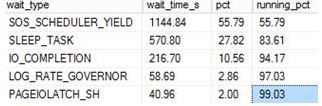
Then I use the query from the above link which is based on  sys.dm_os_wait_stats  to check wait stats returning the following snippet (I did not clear anything out beforehand):

waitsmain

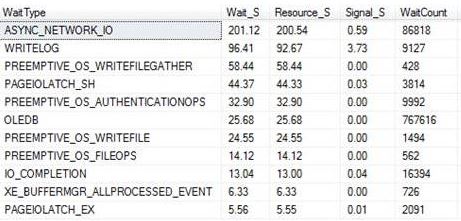
This tells me about the waits since my last reboot or since a manual reset of the stats. It’s probably why you should do at least time-based analysis or reset the wait stats before starting, that is if you are interested in something time specific or if you want to understand certain workloads at a given time.

So the other option is that you could go down the session level route. With the session based analysis I took the query and changed it slightly to query sys.dm_exec_session_wait_stats and also pull back the session_id that I am interested in.

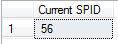
First thing is that I used the following to get an ID of interest. This was actually the connection for when I ran the CHECKDB command – SPID 56.


SELECT @@SPID AS [Current SPID]

spid56

I then use this ID within the WHERE clause of the query so I could track it to get session level wait stats.

checkwait

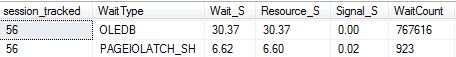
As you would expect it is very specific and quite relevant for the workload (CHECKDB) and for that moment in time only. Its definitely not a replacement technique for the other traditional ways but it could be something that you could use if you want to track a session ID real time.

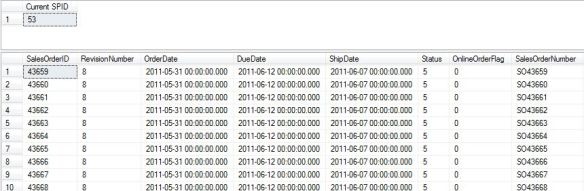
Here is another example, this time tracking session_id 53 which is a big SELECT statement.

select.JPG

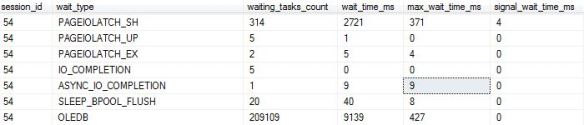
Session level waits:

rbar

Using the DMV in its most simplest form would return the following:

SELECT * FROM sys.dm_exec_session_wait_stats
WHERE session_id = 54

simple


I guess you could even use sys.dm_exec_session_waits_stats to get some further details when/if you query sys.dm_exec_sessions or anywhere else where you can join onto the session_id, such as:

SELECT
s.program_name,s.login_time,s.database_id, cws.wait_type,cws.wait_time_ms
FROM sys.dm_exec_session_wait_stats AS cws
JOIN sys.dm_exec_sessions AS s
ON cws.session_id = s.session_id
WHERE cws.session_id = 54
ORDER BY wait_time_ms DESC

Snippet:

waits2016_2

Checking Time Zones in SQL Server

I was building some basic queries around time zone manipulation and I am happy to say that I enjoyed myself as I found a way to get a time based on a geographic region.

This new feature is available to you from SQL 2016 which obviously means SQL database too (Azure). It is called AT TIME ZONE.

AT TIME ZONE implementation relies on following registry hive where time zones are installed: KEY_LOCAL_MACHINE\SOFTWARE\Microsoft\Windows NT\CurrentVersion\Time Zones. This is exposed via the following query


SELECT * FROM sys.time_zone_info

Looking at books on line via https://msdn.microsoft.com/en-us/library/mt612790.aspx it is wrong.

Look at the screen shot, it states it is supported from SQL 2008 – well it is not, it only works on 2016.

times

Running it on a non SQL 2016 server you will get the following message:

Msg 208, Level 16, State 1, Line 1 Invalid object name ‘sys.time_zone_info’.

On a correct SQL version it will return the following. (Snippet)

times2

This information is key as we will use it to build the time zone queries (which is very basic).

SELECT SYSDATETIMEOFFSET() AT TIME ZONE 'GMT Standard Time' AS [My Location]
GO
SELECT SYSDATETIMEOFFSET() AT TIME ZONE 'US Mountain Standard Time' AS [US Mountain Standard Time]
GO
SELECT SYSDATETIMEOFFSET() AT TIME ZONE 'Central Asia Standard Time' AS [Central Asia Standard Time]
GO
SELECT SYSDATETIMEOFFSET() AT TIME ZONE 'AUS Central Standard Time' AS [AUS Central Standard Time]

Based on the zone offset you will get the relevant correct time.

times3


I used to shrink my databases!

This is an entry level post and a response to SQLEspresso’s blog challenge(http://sqlespresso.com/2017/01/10/ooops-was-that-was-me-blog-challenge) where we share mistakes from our “younger” days. My post takes me back 11 years and while it is nothing ground breaking I still  want to convey what shrinking does to your database. Why? Well it was something that I USED to do. ( Again – I will reinforce the point it was a long time ago)

Well not only does it generate a lot of I/O, consumes CPU but it also affects your fragmentation levels in indexes which is what we will look at today.

These tables and indexes are based from Jonathan’s script found here: https://www.sqlskills.com/blogs/jonathan/enlarging-the-adventureworks-sample-databases/

So I issued the below TSQL where I would expect to see no fragmentation after the rebuild (Index level 0 being the leaf node). Yes the page count is low but it’s the concept I want to talk about.


ALTER INDEX PK_SalesOrderHeaderEnlarged_SalesOrderID ON Sales.SalesOrderHeaderEnlarged REBUILD

DECLARE @db_id SMALLINT;
DECLARE @object_id INT;  

SET @db_id = DB_ID(N'AdventureWorks1997');
SET @object_id = OBJECT_ID(N'Sales.SalesOrderHeaderEnlarged');  

IF @db_id IS NULL
BEGIN;
    PRINT N'Invalid database';
END;
ELSE IF @object_id IS NULL
BEGIN;
    PRINT N'Invalid object';
END;
ELSE
BEGIN;
    SELECT * FROM sys.dm_db_index_physical_stats(@db_id, @object_id, NULL, NULL , 'detailed');
END;
GO  

shrink

Now let’s SHRINK. You can actually do this via SQL Server Management Studio.


DBCC SHRINKDATABASE(N'AdventureWorks1997' )
GO

DECLARE @db_id SMALLINT;
DECLARE @object_id INT;  

SET @db_id = DB_ID(N'AdventureWorks1997');
SET @object_id = OBJECT_ID(N'Sales.SalesOrderHeaderEnlarged');  

IF @db_id IS NULL
BEGIN;
    PRINT N'Invalid database';
END;
ELSE IF @object_id IS NULL
BEGIN;
    PRINT N'Invalid object';
END;
ELSE
BEGIN;
    SELECT * FROM sys.dm_db_index_physical_stats(@db_id, @object_id, NULL, NULL , 'detailed');
END;
GO

99.85% avg_fragmentation, in essence the order has been reversed.

shrinkafter
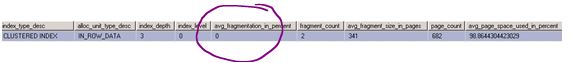
Ok, for a one-of activity I don’t mind  you could just sort out the fragmentation afterwards, but to do it as part of a maintenance routine, not the best option out there. SHAME ON ME!

SQL Server Bugs & Enhancement Requests

T-SQL Tuesday #86: SQL Server Bugs & Enhancement Requests hosted by Brent Ozar.

https://www.brentozar.com/archive/2017/01/announcing-t-sql-tuesday-87-sql-server-bugs-enhancement-requests/

tsql

I did not want to miss out on this one because I want to mention a connect item that I logged last year which is still active.

This is an enhancement request for SQL Server where I got the idea from SQL database (Azure).

Wait Stats is my “go-to” thing, when you want to dig into performance issues everyone knows you will probably end up using sys.dm_os_wait_stats. You cannot use this in the Azure world, you have to use a DMV that is scoped to the database level. I think this would be a nice idea to have with the “earth” based SQL Servers – the ability to return information about all the waits encountered by threads that executed at the database level.

The connect item can be found at this link: https://connect.microsoft.com/SQLServer/feedback/details/2647332/sys-dm-db-wait-stats-dmv?tduid=(262281c4c73a682498780643b77e80d1)(256380)(2459594)(TnL5HPStwNw-KjxCoz0pGWobbq7q1MQTIw)()

An example of using the DMV that I would like:

WITH Waits AS
(SELECT wait_type, wait_time_ms / 1000. AS wait_time_s,
100. * wait_time_ms / SUM(wait_time_ms) OVER() AS pct,
ROW_NUMBER() OVER(ORDER BY wait_time_ms DESC) AS rn
FROM sys.dm_db_wait_stats
)
SELECT W1.wait_type,
CAST(W1.wait_time_s AS DECIMAL(12, 2)) AS wait_time_s,
CAST(W1.pct AS DECIMAL(12, 2)) AS pct,
CAST(SUM(W2.pct) AS DECIMAL(12, 2)) AS running_pct
FROM Waits AS W1
INNER JOIN Waits AS W2
ON W2.rn <= W1.rn
GROUP BY W1.rn, W1.wait_type, W1.wait_time_s, W1.pct
HAVING SUM(W2.pct) - W1.pct <  99

WAITSDMV.JPG

It currently has 8 votes, would be nice to get some more.

Checking DBCC CHECKDB

I hope you run consistency checks on your databases, if you are not currently doing this you probably will want to.

For this post I want to show you how you can check whether or not CHECKDB has been successfully executed.

There are a couple of ways to check this but I will be using DBCC DBINFO for this check.

DBCC DBINFO WITH TABLERESULTS

checkdb

The field of interest here is dbi_dbccLastKnownGood where VALUE of 1900-01-01 00:00:00.000 means that DBCC CHECKDB has never been executed (successfully).

So let’s run CHECKDB and see the value get updated.

DBCC CHECKDB ('ZoraDB')
GO

DBCC DBINFO WITH TABLERESULTS

checkdb2.JPG

The next question I want answering is whether or not this value gets updated if I run CHECKDB with the physical_only option (I created a fresh copy of the database and performed a re-check)

USE [master]
GO

DROP DATABASE [ZoraDB]
GO

CREATE DATABASE [ZoraDB]
 CONTAINMENT = NONE
 ON  PRIMARY
( NAME = N'ZoraDB', FILENAME = N'C:\Program Files\Microsoft SQL Server\MSSQL12.MSSQLSERVER\MSSQL\DATA\ZoraDB.mdf' , SIZE = 5120KB , MAXSIZE = UNLIMITED, FILEGROWTH = 1024KB )
 LOG ON
( NAME = N'ZoraDB_log', FILENAME = N'C:\Program Files\Microsoft SQL Server\MSSQL12.MSSQLSERVER\MSSQL\DATA\ZoraDB_log.ldf' , SIZE = 2048KB , MAXSIZE = 2048GB , FILEGROWTH = 10%)
GO

DBCC DBINFO WITH TABLERESULTS

Below confirms that we are back to a newly created database.

checkdb3.JPG

So we now run it with the PHYSICAL_ONLY option.

DBCC CHECKDB ('ZoraDB') WITH PHYSICAL_ONLY
GO
USE [ZoraDB]
GO
DBCC DBINFO WITH TABLERESULTS

So, stating physical_only updates the value too.

physicalonly.JPG

What about separate checks?

Again I dropped and re-created the database to get back to level playing field.

Let’s work through the DBCC check commands, after a command I will check dbi_dbccLastKnownGood to see if it gets updated.

DBCC CHECKALLOC
GO
DBCC DBINFO WITH TABLERESULTS

checkdb4.JPG

DBCC CHECKCATALOG
GO

DBCC DBINFO WITH TABLERESULTS

checkdb4.JPG

DBCC CHECKTABLE ('dbo.people')
GO
DBCC DBINFO WITH TABLERESULTS

checkdb4.JPG

So checking the database via separate checks has no impact on dbi_dbccLastKnownGood.

What about if the database is corrupted? I re-created the database and corrupted it:

DBCC CHECKDB ('ZoraDB')
GO

CHECKDB found 0 allocation errors and 2 consistency errors in database ‘ZoraDB’.
repair_allow_data_loss is the minimum repair level for the errors found by DBCC CHECKDB (ZoraDB).
DBCC execution completed. If DBCC printed error messages, contact your system administrator.

DBCC DBINFO WITH TABLERESULTS

checkdb4

Naturally it will not get updated because it was unsuccessful – If we fixed the corruption and ran CHECKDB it would then get updated with the current timestamp.

DO NOT RUN REPAIR WITH THIS OPTION – THIS IS AN EXAMPLE ONLY! It deleted my data!! THIS IS A LAST RESORT – WARNING.

ALTER DATABASE [ZoraDB] SET SINGLE_USER;
GO

DBCC CHECKDB    ('ZoraDB'  , REPAIR_ALLOW_DATA_LOSS )

ALTER DATABASE [ZoraDB] SET MULTI_USER;
GO

DBCC CHECKDB ('ZoraDB')
GO

CHECKDB found 0 allocation errors and 0 consistency errors in database ‘ZoraDB’.

DBCC execution completed. If DBCC printed error messages, contact your system administrator.

checkdb6.JPG

There you have it – the updated value.