Query Performance Insight

It is really easy getting insight into Query performance within your Azure SQL DB. I think Microsoft have done a good job with the User Interaction and with the information provided – even though I would have liked to see a metric type on I/O. Never the less lets dig in.

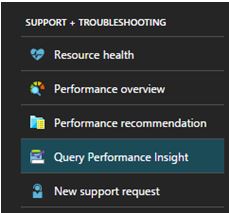
On you Azure DB under support and troubleshooting click on Query Performance Insight.

query1

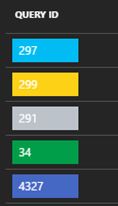
Here you will be presented with the TOP X queries based on CPU, Duration or Execution count. You will have the ability to change the time period of analysis, return 5, 10 or 20 queries using aggregations SUM, MAX or AVG.

So let’s look at what information is provided based on queries with high AVG duration over the last 6 hours.

query2

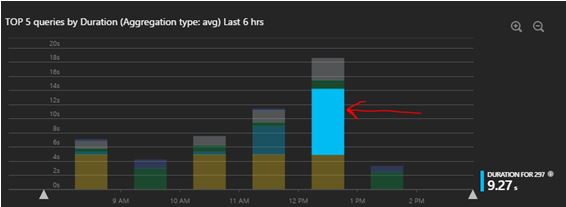
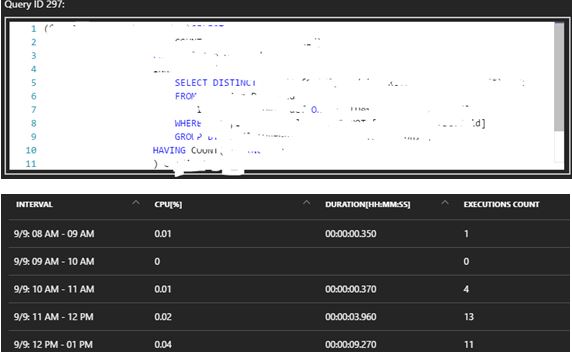
Once you have highlighted the section on the bar chart that interests you (red arrow), you will be presented with the duration time for that query ID. For this it is query ID 297 that had an Avg duration of 9.27S.

query3

So you can then click the 297 ID button to dig in deeper where you can get the Query text and get timed interval analysis.

query4

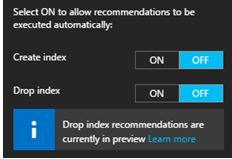
Now, there is a “recommendation” button – here you can have the ability to even automate index maintenance, personally this isn’t something I would automate – I would like to see what they recommend and analyse it myself.

query5

Pretty powerful (and colourful) stuff available at your finger tips.

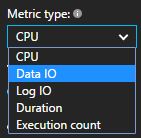
UPDATE: 6TH OCTOBER 2016 – I have been contacted by Microsoft Query Performance Insight PM where he kindly informed me that I/O is now tracked (if you recall at the start of the article it was something that I would’ve loved to see – now I can ).

So back in the Query Performance Insight menu – you will see Data IO and Log IO.

data1

You will now have the ability to see a line graph to see a trend (if it exists) for these new metrics.

8200

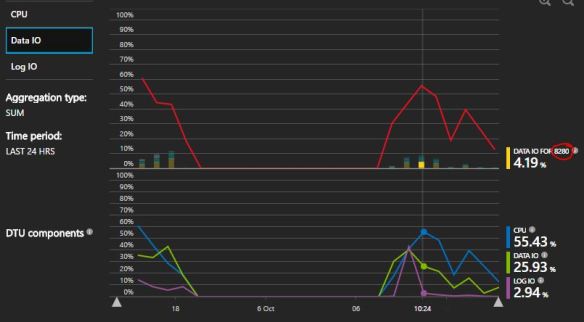
Then as mentioned before you would correlate this back to the Query ID to understand the TSQL being executed. So for this example I would dig into Query ID 8280.

qwer

It ended up being a pretty poor SELECT statement in much need of some optimization.


DBCC HELP

I was going through some online courses and came across Erin Stellato’s Course on DBCC commands.http://www.sqlskills.com/blogs/paul/new-course-understanding-and-using-dbcc-commands/

I learnt something new! It’s not that complicated but I have found it useful. It is called DBCC HELP.

The command returns syntax information for a specific DBCC command, pretty useful if you have forgotten the syntax to write for example CHECKDB with extended logical checks and no informational messages. (Just an example)

So execute the below.

DBCC HELP ('?');
GO

This will give you a list of what you can pass into DBCC HELP – Yep checkdb is there.

checkalloc
checkcatalog
checkconstraints
checkdb
checkfilegroup
checkident
checktable
cleantable
dbreindex
dropcleanbuffers
free
freeproccache
freesystemcache
help
indexdefrag
inputbuffer
opentran
outputbuffer
pintable
proccache
show_statistics
showcontig
shrinkdatabase
shrinkfile
sqlperf
traceoff
traceon
tracestatus
unpintable
updateusage
useroptions

So let’s pass in CHECKDB.

DBCC HELP (CHECKDB);
GO

OUTPUT:

/**
dbcc CHECKDB
(
    { 'database_name' | database_id | 0 }
    [ , NOINDEX
    | { REPAIR_ALLOW_DATA_LOSS
    | REPAIR_FAST
    | REPAIR_REBUILD
    } ]
)
    [ WITH
        {
            [ ALL_ERRORMSGS ]
            [ , [ NO_INFOMSGS ] ]
            [ , [ TABLOCK ] ]
            [ , [ ESTIMATEONLY ] ]
            [ , [ PHYSICAL_ONLY ] ]
            [ , [ DATA_PURITY ] ]
            [ , [ EXTENDED_LOGICAL_CHECKS  ] ]
        }
    ]

**/

So now you will know without googling how to write your command:

DBCC CHECKDB ('AdventureWorks2020')
WITH NO_INFOMSGS, EXTENDED_LOGICAL_CHECKS

SQL Server checkpoints

I was having a conversation with someone over a disgusting vanilla latte and we talked about shutting down a machine and how to confirm if SQL Server starts to checkpoint the databases on the server – obviously it makes sense why it needs to do this but how do we confirm it?

Via Configuration manager I enabled trace flags 3502 and 3605 – both needed to get the checkpoint information and write it to the error log.

I then shutdown the machine, on start-up I looked into the error log.

EXEC XP_READERRORLOG

checks

Notice the ‘s’ in front of the spid<number>? Well that means the checkpoint was done via the automatic process; if you do a manual checkpoint it won’t see this letter.

CHECKPOINT;
GO
EXEC XP_READERRORLOG

check1

If you want to know what is actually being written (number of Bufs etc) then that is trace flag 3504.


Talking of checkpoint

I was having a conversation with someone over a disgusting vanilla latte and we talked about shutting down a machine and how to confirm if SQL Server starts to checkpoint the databases on the server – obviously it makes sense why it needs to do this but how do we confirm it?

Via Configuration manager I enabled trace flags 3502 and 3605 – both needed to get the checkpoint information and write it to the error log.

I then shutdown the machine, on start-up I looked into the error log.

EXEC XP_READERRORLOG

checks

Notice the ‘s’ in front of the spid<number>? Well that means the checkpoint was done via the automatic process; if you do a manual checkpoint it won’t see this letter.

CHECKPOINT;
GO
EXEC XP_READERRORLOG

check1

If you want to know what is actually being written (number of Bufs etc) then that is trace flag 3504.


Do YOU Checksum?

I am going to show you why you should be using checksum options on your backups (and restores).
I AM ACTUALLY NOT GOING TO WRITE THE CODE TO FORCE THIS CORRUPTION. I am starting to feel bad spreading/writing about the commands involved.

Anyways I did what was necessary for this demo and running a SELECT we now have:

SELECT * FROM testtable

SQL Server detected a logical consistency-based I/O error:
incorrect checksum (expected: 0xe41c795b; actual: 0xe41c3c5b).
It occurred during a read of page (1:55) in database ID 10 at offset 0x0000000006e000 in file ‘C:\Program Files\Microsoft SQL Server\MSSQL10_50.MSSQLSERVER\MSSQL\DATA\DBMaint2008.mdf’. Additional messages in the SQL Server error log or system event log may provide more detail. This is a severe error condition that threatens database integrity and must be corrected immediately. Complete a full database consistency check (DBCC CHECKDB). This error can be caused by many factors; for more information, see SQL Server Books Online.

Let’s create some backups without checksums.

BACKUP DATABASE [DBMaint2008] TO DISK = 'C:\sqlserver\DBMaint2008pre.bak'

It works- BACKUP DATABASE successfully processed 186 pages in 0.140 seconds (10.351 MB/sec).

--The backup set on file 1 is valid
RESTORE VERIFYONLY FROM DISK =  'C:\sqlserver\DBMaint2008pre.bak'

We did a RESTORE of the DATABASE successfully – processed 186 pages in 0.232 seconds (6.246 MB/sec).

RESTORE DATABASE [DBMaint2008DR]
FROM  DISK = N'C:\sqlserver\DBMaint2008pre.bak' WITH  FILE = 1,
MOVE N'DBMaint2008'
TO N'C:\Program Files\Microsoft SQL Server\MSSQL10_50.MSSQLSERVER\MSSQL\DATA\DBMaint2008DR.mdf',
MOVE N'DBMaint2008_log'
TO N'C:\Program Files\Microsoft SQL Server\MSSQL10_50.MSSQLSERVER\MSSQL\DATA\DBMaint2008DR_log.LDF',
NOUNLOAD,  STATS = 5
GO

Are things really ok on this newly recovered database?

DBCC CHECKDB ('DBMaint2008DR')

I dont think so – CHECKDB found 0 allocation errors and 2 consistency errors in database ‘DBMaint2008DR’.

At least let’s have a checksum in place for protection from this kind of thing.

BACKUP DATABASE [DBMaint2008] TO DISK = 'C:\sqlserver\DBMaint2008POST.bak'
WITH CHECKSUM, STATS = 10
GO

12 percent processed.
21 percent processed.
Msg 3043, Level 16, State 1, Line 14
BACKUP ‘DBMaint2008’ detected an error on page (1:55) in file ‘C:\Program Files\Microsoft SQL Server\MSSQL10_50.MSSQLSERVER\MSSQL\DATA\DBMaint2008.mdf’.
Msg 3013, Level 16, State 1, Line 14
BACKUP DATABASE is terminating abnormally.

Can you imagine if you did neither Checksum or consistency checks? I don’t think I want to imagine such an environment.